

The correct way to compare research peptide prices is the purity-adjusted cost-per-milligram (PAC-mg), calculated from lot-specific Certificate of Analysis data, not the sticker price per vial. A listing with a lower sticker price and slightly lower reported purity can cost more per verified milligram than a higher-priced, higher-purity listing once you account for actual peptide content. Treat any single-number purity claim without a matching lot COA as incomplete. Documentation-first sources like Data Peptides and Trusted American Peptides exist because researchers need that math, not marketing.
TL;DR:
- The true cost of peptides is driven by the purity-adjusted cost-per-milligram, which requires lot-specific COA verification rather than relying on sticker price or reported purity alone.
- Longer peptides and those with modifications generally have higher costs due to more complex synthesis, purification challenges, and lower yields, especially as sequence length increases past 30 amino acids.
- Independent verification of peptide purity through mass spectrometry and absolute content measurement is essential to confirm vendor claims and avoid hidden costs from incomplete documentation or unreliable testing.
- Bulk vial sizes can lower PAC-mg but only if the material is used within the stable storage period, as degradation of reconstituted peptides can inflate the real cost beyond initial estimates.
- Regional pricing differences reflect shipping and handling, with domestic sourcing offering faster delivery and fewer transfer risks, but added verification costs are necessary when ordering from international suppliers.
Table of Contents
- Peptide Pricing Guide Basics: The PAC-mg Formula
- What Drives Peptide Price: Synthesis and Testing Factors
- How Do You Verify a Vendor’s Purity Claims?
- Red Flags That Signal Pricing Risk, Not Savings
- Typical RUO Price Ranges by Peptide Category
- Your Buying Checklist for the Next Procurement Cycle
- HPLC Area Percent vs. Absolute Peptide Content: What’s the Difference?
- Solid-Phase vs. Liquid-Phase Synthesis: Why the Method Changes the Price
- Do Volume Discounts Make Sense for Research Peptide Orders?
- Do Regional Pricing Differences Matter for Research Buyers?
- Why Peptide Stability Affects Your Real Cost Per Milligram
- Author Perspective: Why Documentation Matters More Than Sticker Price
- How Data Peptides Supports Verified Purchasing
- Sources
- FAQ
Peptide Pricing Guide Basics: The PAC-mg Formula
Every peptide pricing comparison should run through one equation:
PAC-mg = (Total Price + Shipping + Audit Cost) / (Total mg × Purity Fraction)
The three inputs matter more than they look. “Total mg” means label mass on the vial. “Purity fraction” should come from absolute peptide content, not the headline HPLC number. “Audit cost” covers third-party verification when a vendor’s own COA isn’t enough to trust on its own, and that check typically runs $300 to $500 per sample.
Here’s a worked comparison:
- Vendor A: 5 mg vial, $150, labeled 98% HPLC purity, no absolute content figure disclosed. Assume a conservative 85% verified peptide content once counterion mass is factored in. PAC-mg = $150 / (5 × 0.85) = $35.29/mg.
- Vendor B: 5 mg vial, $220, COA reports 99% HPLC purity AND 96% absolute peptide content. PAC-mg = $220 / (5 × 0.96) = $45.83/mg.
- Add a several-hundred-dollar audit cost to Vendor A because its COA lacks absolute content data, increasing its PAC-mg significantly compared to Vendor B once verification is priced in.
The cost-per-mg indexing method confirms this pattern across the market: nominal vial size and headline purity routinely distort what a buyer is actually paying for verified material.
What Drives Peptide Price: Synthesis and Testing Factors
Sequence length is the single biggest lever. Solid-phase peptide synthesis (SPPS) builds a chain one amino acid at a time, and each added residue introduces a coupling and deprotection cycle that can fail. Longer peptides accumulate more failure points, which means lower yields and more purification work per finished milligram.
Beyond length, several factors compound the cost:
- Structural modifications like fatty-acylation, PEGylation, or nonstandard amino acids require specialized reagents and often a dedicated purification method, not the standard reverse-phase run.
- Batch scale changes unit economics sharply. A 100 mg production run spreads fixed costs (column time, solvent, analyst hours) across far more finished product than a 1 mg run.
- Vial size and lyophilization add fixed per-unit costs. Freeze-drying, sealing, and labeling a 1 mg vial costs nearly the same as doing it for a 10 mg vial, which is why small vials always carry a per-mg premium.
- Per-lot analytical testing (HPLC, mass spectrometry, endotoxin screening) is a real line-item cost that vendors either absorb into price or skip entirely. Manufacturing complexity across length, modification, and purification depth explains most of the price spread you’ll see between compounds of similar size.
Pro Tip: If a listing doesn’t mention a testing method by name (RP-HPLC, LC-MS), assume it wasn’t independently verified. Silence on method is itself a data point.
How Do You Verify a Vendor’s Purity Claims?
Treat verification as a five-step filter before any purchase clears your procurement list:
- Match the lot number. The COA on the product page must carry the same lot number printed on the vial you receive, with a COA date that makes sense against manufacturing.
- Check the HPLC method details. A chromatogram alone means little. Look for column type, mobile phase, detection wavelength, and run time. Reports that omit method details are harder to trust.
- Confirm mass spectrometry identity. MS confirms the molecule is the sequence claimed, something HPLC alone cannot do since HPLC only measures relative retention behavior.
- Demand absolute peptide content, not just area percent. A COA showing “99% HPLC purity” with no salt-form or content-by-mass figure is telling you less than it appears to.
- Verify the testing lab is real and independent, ideally supplied by a trusted partner like ABMIUM for research reagents. A named, checkable third-party lab carries more weight than an in-house “quality department” claim.
For studies requiring quantitative comparability across experiments, running an independent RP-HPLC check on receipt is a defensible norm, with MS confirmation preferred when budget allows. As a decision rule: pay for third-party confirmation when the compound is going into a comparative study, a novel sequence, or a vendor you haven’t ordered from before. Skip it only for repeat orders from a supplier with a consistent lot-to-lot track record.
Red Flags That Signal Pricing Risk, Not Savings
Some warning signs show up before you even open a COA:
- No lot-specific COA offered before purchase, only a generic “typical purity” document.
- A testing lab name that can’t be found or verified independently.
- A price dramatically below the typical range for a peptide of that length or modification complexity.
- Bundled “kits” with opaque per-item pricing that make PAC-mg impossible to calculate.
- Crypto-only payment options with no return or replacement policy.
Every one of these shifts risk onto the buyer. A $50 savings on a vial that turns out to need a $400 audit, or worse, invalidates a research run, is not a savings at all.
Typical RUO Price Ranges by Peptide Category
Category matters more than any single vendor’s pricing page. Reported ranges group into three tiers based on sequence length and complexity:
- Short peptides (≤15 amino acids): generally the lowest per-vial price and often the lowest PAC-mg, since synthesis cycles and purification burden are minimal.
- Medium peptides (16 to 29 amino acids): mid-range pricing, with more variability driven by whether the sequence includes difficult couplings.
- Long or complex peptides (30+ amino acids, or with modifications): the highest range, driven by lower synthesis yields and heavier purification demands.
These tiers hold across current market summaries, though vial size shifts the picture within each tier. Larger vials (10 mg versus 1 mg) usually deliver a meaningfully lower PAC-mg because fixed packaging and lyophilization costs get spread across more product. Always run PAC-mg on the listed price before assuming category alone tells you the real cost.
Your Buying Checklist for the Next Procurement Cycle
Turn the framework above into a short, repeatable process:
- Rank every shortlisted offer by PAC-mg, not by sticker price.
- Confirm the lot COA matches the vial before finalizing payment.
- Budget for on-receipt verification when the compound is unfamiliar or comparative accuracy matters.
- Match vial size to expected study duration, and add 5 to 10 percent to your calculated mg need to account for typical overfill variance.
- Log every verification step in your procurement records so results stay reproducible if a colleague or reviewer needs to retrace your sourcing.
Pro Tip: Keep a running PAC-mg spreadsheet across vendors and lots. Six months in, it becomes the fastest way to spot a supplier whose quality is drifting before an experiment tells you the hard way.
HPLC Area Percent vs. Absolute Peptide Content: What’s the Difference?
HPLC area percent measures the proportion of a chromatogram’s peak area that belongs to your target peptide relative to everything else that eluted. It’s a measure of relative purity among detected compounds, not a measure of how much actual peptide is in the vial by weight.
Absolute peptide content is different. It accounts for water content, residual salts, and counterions like trifluoroacetic acid (TFA) that remain bound to the peptide after synthesis.
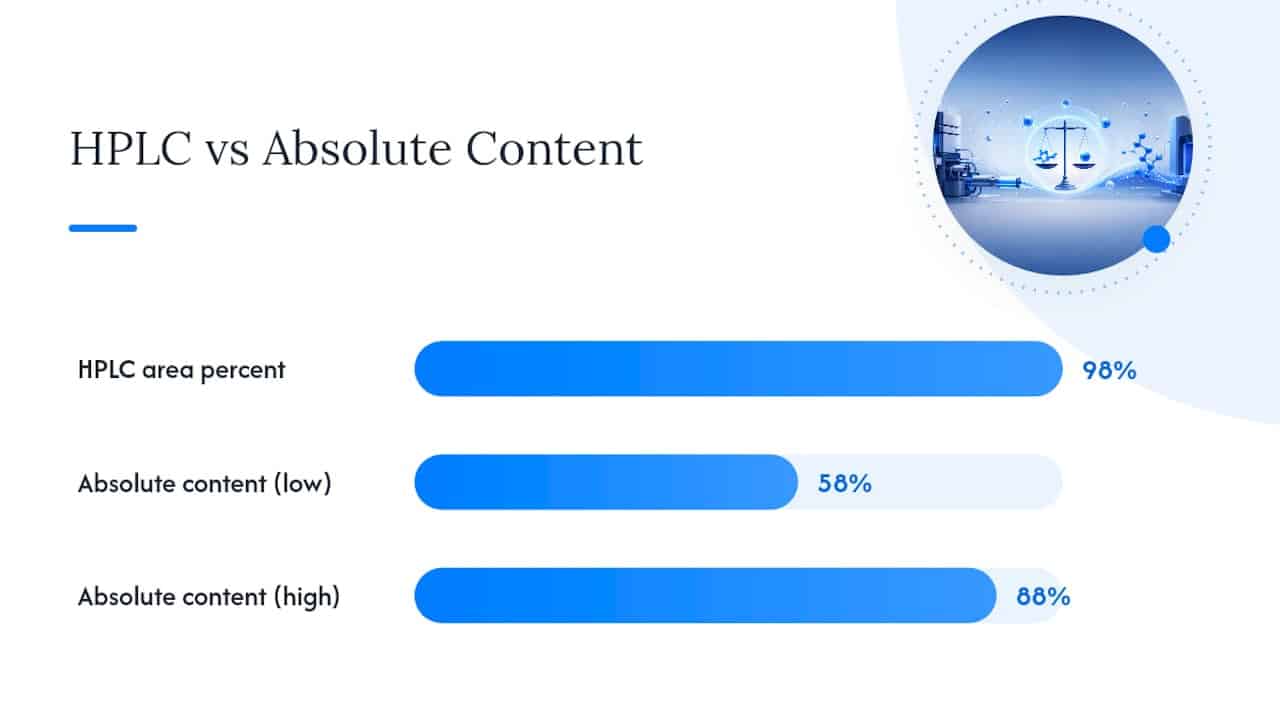
The gap between these two numbers isn’t trivial. Residual TFA counterions and moisture commonly reduce absolute peptide content by 10 to 40 percent in TFA-salt peptides compared to the HPLC number on the label. That means a “98% pure” peptide could deliver anywhere from 58% to 88% actual peptide content depending on salt form and moisture, an enormous swing for anyone calculating dosing or PAC-mg from label numbers alone.
Counterion exchange or desalting reduces this gap but adds a processing step, which is part of why fully characterized peptides (those reporting both figures) tend to cost more than “tested” peptides that report HPLC area percent alone. When a COA lists both numbers, use the absolute content figure for every calculation. When it lists only HPLC area percent, treat the purity fraction in your PAC-mg formula as an estimate, not a fact, and weight your risk assessment accordingly.
Solid-Phase vs. Liquid-Phase Synthesis: Why the Method Changes the Price
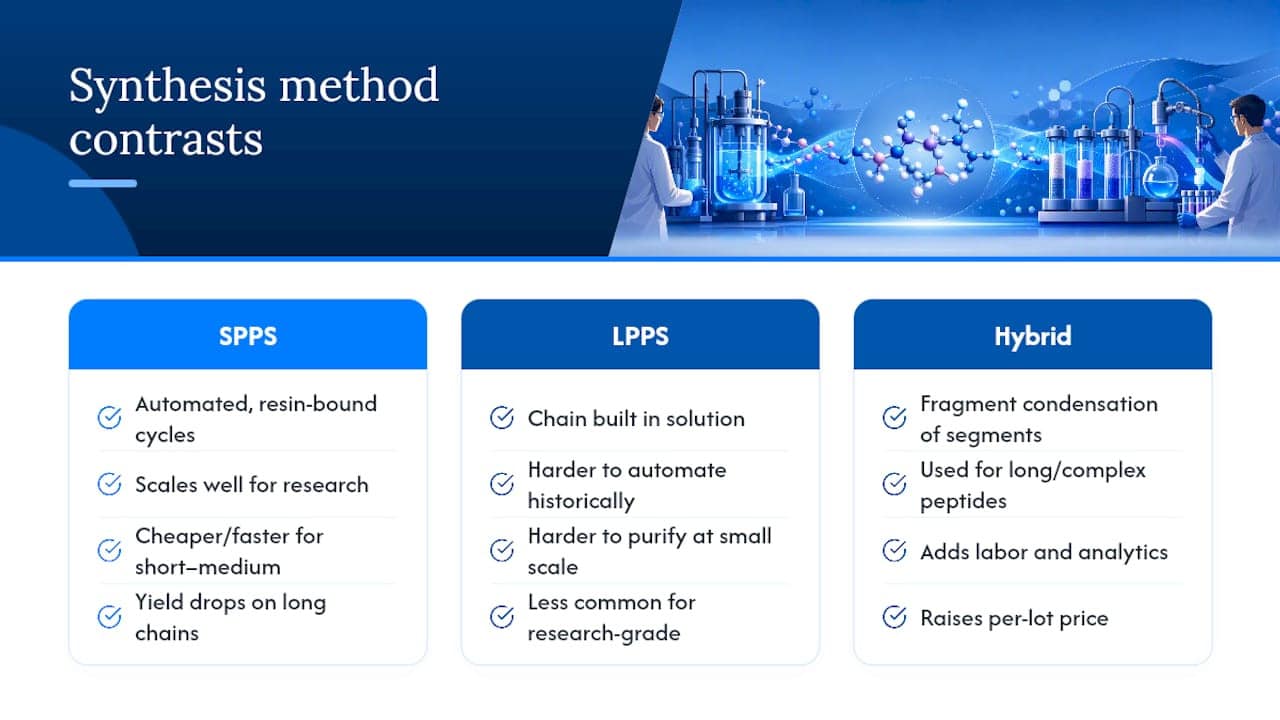
Solid-phase peptide synthesis (SPPS) dominates research-grade peptide manufacturing today, and for good reason: it allows automated, cycle-by-cycle chain assembly on a resin support, which scales well and supports standardized purification afterward. Liquid-phase peptide synthesis (LPPS), by contrast, builds the chain in solution, which historically made it harder to automate and purify at small research scale.
For most short and medium sequences, SPPS is both faster and cheaper per milligram because the resin-bound intermediate can be washed clean between steps without isolating each one. That efficiency is exactly why SPPS-produced peptides make up the bulk of what you’ll see priced competitively across the research-use-only market.
Longer or structurally complex peptides shift the calculus. Extended SPPS runs accumulate more incomplete couplings and truncated byproducts as the chain grows, which drags down yield and forces more aggressive purification, both of which raise cost. Some manufacturers use hybrid or fragment-condensation approaches, synthesizing shorter segments and joining them, specifically to control this yield loss on longer sequences. That hybrid step adds labor and analytical verification, which shows up directly in price.
For procurement purposes, the synthesis method itself matters less than what it implies about testing depth. A vendor using fragment condensation on a 40-residue peptide should be running more rigorous per-lot MS confirmation than a vendor synthesizing a 10-residue peptide by standard SPPS, because there are simply more places for something to go wrong. If a listing doesn’t specify synthesis approach for a long or modified peptide, that’s a reasonable question to ask before ordering, not after.
Do Volume Discounts Make Sense for Research Peptide Orders?
Bulk pricing tiers exist across the research peptide market, and they follow the same logic as most lab-reagent purchasing: fixed costs (packaging, documentation, shipping) get spread across more product, so per-mg price drops as order size grows.
The math only works in your favor if you’ll actually use the material before it degrades or before your study protocol changes. Run your PAC-mg calculation against your realistic consumption timeline, not just the vendor’s tier pricing table, before committing to a larger order.
Bulk orders also concentrate lot risk. A single COA now covers your entire supply for a study rather than being split across multiple smaller, independently tested lots. That’s fine when the vendor’s testing is rigorous and the lot is well characterized. It becomes a bigger problem if that one COA turns out to be incomplete, since you have no fallback lot to compare against. For multi-month studies, some procurement teams deliberately split a bulk need across two smaller lots from the same vendor specifically to create that comparison point, accepting a slightly higher blended PAC-mg in exchange for a reproducibility check.
Ask vendors directly whether volume tiers include the same testing depth as single-vial orders. A discount that comes with reduced documentation isn’t really a discount once you price in the audit cost you’ll need to fill that gap.
Do Regional Pricing Differences Matter for Research Buyers?
Pricing on research peptides varies by region, driven mostly by shipping logistics, import handling, and the density of manufacturing and testing infrastructure in a given market rather than by any difference in the underlying chemistry.
For researchers buying within the United States, sourcing from domestic, US-based suppliers generally means faster delivery and fewer customs variables that can affect cold-chain integrity in transit. A peptide that spends extra days in customs handling faces more temperature exposure risk, which matters for reproducibility even if the COA at time of shipping was accurate.
Cross-border orders can look cheaper on the vendor’s sticker price, but they carry additional variables that belong in your PAC-mg audit cost line: customs delay risk, less predictable cold-chain handling, and in some cases weaker recourse if a shipment arrives compromised. Domestic sourcing simplifies that risk profile even when the base price looks slightly higher. When comparing offers across regions, add a conservative buffer to the “audit cost” term in your PAC-mg formula for any vendor whose shipping route or handling practices you can’t directly verify.
Why Peptide Stability Affects Your Real Cost Per Milligram
Peptides are chemically fragile compared to most lab reagents. Lyophilized (freeze-dried) peptides are generally stable when stored correctly, but reconstituted peptides degrade faster, and improper storage at any stage can silently reduce the actual usable peptide content below what the original COA reported.
This matters directly for PAC-mg. The formula assumes the purity and mass figures on the COA still hold true at the point of use. If a vial sits in transit without proper cold-chain handling, or if a lab stores lyophilized product at room temperature for an extended period, degradation can lower the effective purity fraction below the tested value, silently raising your real cost per usable milligram above what you calculated at purchase.
Budgeting for stability means two things in practice. First, factor storage requirements (typically frozen or refrigerated, protected from light and moisture) into your total cost of ownership, including any freezer capacity or backup power you need to maintain it. Second, size your vial purchase to your actual consumption timeline rather than buying in bulk purely for a lower sticker price, since unused reconstituted material sitting past its stable window becomes a sunk cost that no PAC-mg calculation can recover. A slightly higher per-mg price on a properly sized order is often the better economic choice once storage risk is priced in honestly.
Author Perspective: Why Documentation Matters More Than Sticker Price
Documentation matters more than packaging. A lot-specific COA with absolute peptide content and third-party HPLC/MS confirmation costs more to produce than a generic purity claim, and that cost shows up in price. It should. Researchers who skip that line item aren’t saving money. They’re deferring the cost to whenever their results don’t replicate and nobody can trace why. Prioritizing PAC-mg over sticker price isn’t a hedge against fraud alone. It’s how reproducible research gets built in the first place.
How Data Peptides Supports Verified Purchasing
Every lot Data Peptides ships carries a lot-specific COA with third-party HPLC and mass spectrometry confirmation, not a generic purity statement reused across batches. That documentation depth is what lowers your audit line item in the PAC-mg formula, since you’re not paying an outside lab to confirm what should already be on the label.
Shipping is fast and discreet, and support runs 24/7 for researchers who need a COA question answered before a study timeline slips. If you’re ready to price out your next order using the framework above, browse the Data Peptides shop to compare lots directly against their published COAs, or start from the main catalog to see current inventory across categories.
Sources
For deeper methodology on the calculations in this guide, see the PAC-mg analytical framework, purity standards explainer, and current price indexing data. For hands-on ordering guidance, see Data Peptides’ ordering guide.
- How to compare research peptide prices online: a data-driven analytical framework
- Research Peptide Pricing Explained 2026 | PurePep Vital
FAQ
What is PAC-mg and why does it matter more than sticker price?
PAC-mg (purity-adjusted cost-per-milligram) divides total landed cost by verified peptide mass, which accounts for purity and audit costs that a raw vial price ignores. Two vials priced differently can have PAC-mg values that flip the value comparison entirely.
How much does third-party peptide testing typically cost?
Independent audit testing for a single sample generally runs $300 to $500, and that figure should be added to the numerator of your PAC-mg calculation whenever a vendor’s own COA leaves gaps.
Why can a 98% pure peptide actually contain much less peptide by mass?
Residual TFA counterions and moisture can reduce absolute peptide content by 10 to 40 percent compared to the HPLC area percent figure, since that number measures chromatographic purity, not mass composition.
Is it worth paying more for a vendor with full COA documentation?
Yes, in most cases, because a lot-specific COA with absolute content and third-party HPLC/MS confirmation removes the need for an in-house audit, which usually offsets or exceeds the price premium once verification costs are counted.
Do longer peptides always cost more per milligram?
Generally yes. Longer sequences require more synthesis cycles and accumulate more purification difficulty, which is why long or heavily modified peptides sit at the top of typical research peptide pricing ranges.
Should I buy the largest vial size to save money?
Only if your study will use the material within its stable storage window. Larger vials usually lower PAC-mg, but unused reconstituted peptide that degrades before use erases any savings from the bulk discount.