

Assay measures how much of a specific target compound is present, benchmarked against a reference standard. Purity measures how clean that sample is by quantifying everything that isn’t the target. A batch can pass its assay spec slightly above 100% and still fail release because a measurable unidentified peak shows up on the impurity profile. Both numbers matter, and neither substitutes for the other on a Certificate of Analysis.
TL;DR:
- Assay results can measure over 100% due to calibration, standard purity, or response factor variations, which are common and not necessarily problematic.
- Purity assessments focus on identifying and quantifying impurities through chromatographic and mass spectrometry methods, often requiring multiple orthogonal tests for accuracy.
- Discrepancies between assay and purity values should be checked with re-testing, response factor verification, and orthogonal methods before flagging any batch.
- Regulatory standards treat assay and impurity limits separately, with impurities typically having stricter thresholds for batch release decisions.
- Reliable CoAs should include detailed, validated method information, reference standard traceability, measurement uncertainty, and proper documentation for trustworthy quality assessment.
Table of Contents
- Assay vs Purity: A Head-to-Head Comparison
- How Labs Actually Measure Assay and Purity
- Why Assay Can Read Over 100% While Purity Never Does
- What Assay and Purity Mean for QC and Batch Release
- Choosing and Validating the Right Tests: A Practical Checklist
- Why Transparency in Assay and Purity Reporting Actually Matters
- Getting Research-Grade Materials With Verified Assay and Purity Data
- Sources
- FAQ
Assay vs Purity: A Head-to-Head Comparison
Assay answers “how much active compound is here?” Purity answers “what else is in this sample besides the active compound?” They sound like two sides of the same coin, but they’re calculated differently, reported differently, and fail for different reasons.
- Assay is reported as a percentage relative to a reference standard, often expressed as mass fraction or potency (for example, 98.7% of label claim).
- Purity is typically reported as area percent by chromatography or mass fraction by qNMR, reflecting the proportion of the sample that is the target molecule versus impurities.
- Assay gets used for release testing, potency confirmation, and verifying label claims on incoming raw materials.
- Purity gets used for impurity profiling, stability studies, and troubleshooting unexpected chromatographic peaks.
A CoA excerpt makes the distinction concrete. Imagine a peptide lot reporting “Assay: just over 100% by HPLC (vs. USP reference standard)” alongside “Purity: just under 98% by HPLC, with a measurable impurity just above 1%.” The assay result says the potency is right on target. The purity line says there’s a measurable impurity that still needs identification before anyone signs off on release.
How Labs Actually Measure Assay and Purity
Assay testing and purity testing pull from overlapping but distinct toolkits, and knowing which tool answers which question keeps you from misapplying a method.
Assay methods typically include:
- HPLC potency assays using external or internal standard calibration, comparing peak response against a known reference.
- Titration, still common for small molecules with well-defined stoichiometry.
- qNMR for direct, standard-free assay of mass fraction in organic compounds.
- Functional or bioassays, including ELISA and ligand-binding assays, when biological potency, not just chemical concentration, is the question.
Purity methods lean more heavily on separation and identification:
- Chromatographic impurity profiling via HPLC or GC, flagging every peak beyond the main compound.
- LC-MS for identifying unknown impurities by mass, not just retention time.
- Mass-balance approaches, which sum known impurity classes (water, residual solvent, related substances) and subtract from 100%.
- qNMR, again, but here used for direct mass-fraction purity rather than potency.
- ICP-MS or ICP-OES for inorganic and elemental impurities that chromatography misses entirely.
No single technique catches everything. A compound with a non-chromophoric impurity slips past UV-detected HPLC undetected. That’s why IUPAC’s technical guidance on orthogonal methods recommends combining at least two independent techniques so an impurity invisible to one method gets caught by another.
Validation requirements diverge here too. Assay validation leans on accuracy, linearity, and system suitability against the reference standard. Purity validation puts more weight on specificity, limit of detection, and limit of quantitation, since the whole point is catching trace-level unknowns.
Pro Tip: If your impurity profile relies solely on UV detection, run a parallel check with LC-MS or ELISA cross-validation on a subset of lots, as explained in the Legal Highs Qualität erkennen: Kein Blindflug – Rauschrebell. Reagent quality and antibody purification matter as much as instrument settings for immunoassay-based potency testing.
Why Assay Can Read Over 100% While Purity Never Does
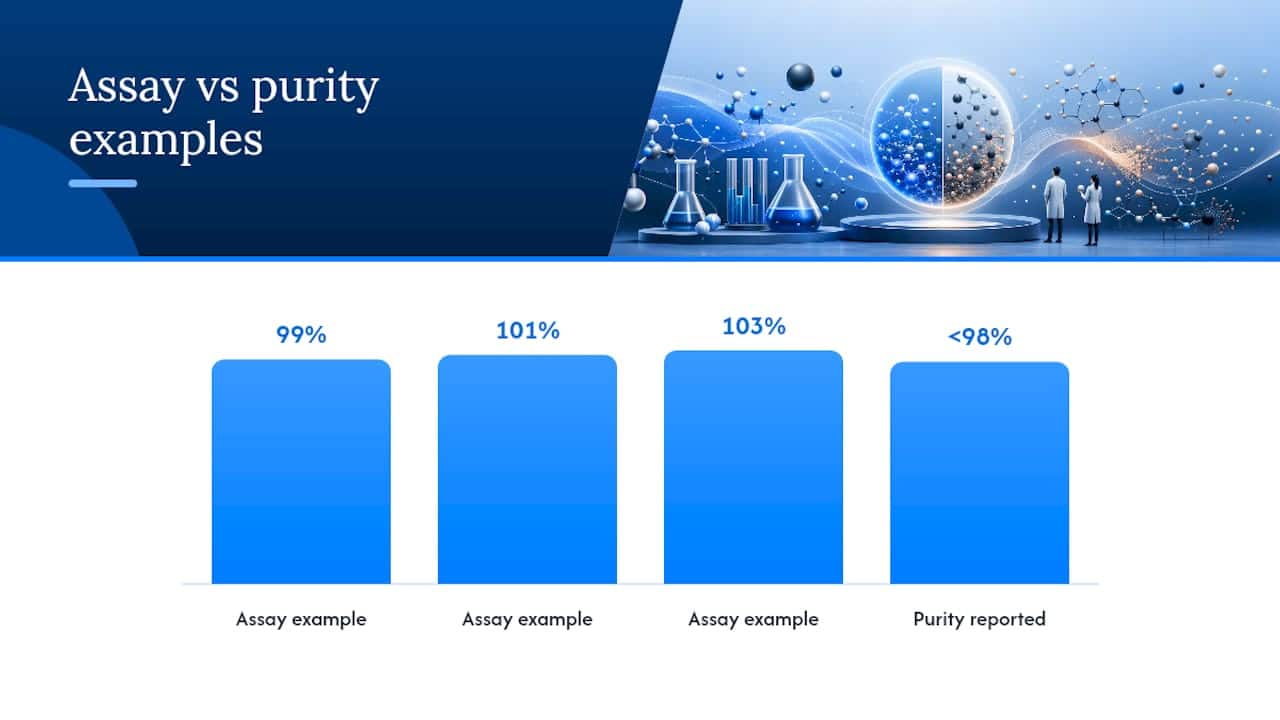
Assay results routinely land at 99%, 101%, even 103%, and that’s not automatically a red flag. Assay is a ratio against a reference standard, so small differences in response factor, calibration curve slope, or standard purity can push the number slightly above 100%.
That distinction explains some counterintuitive lab scenarios:
- High assay, detectable impurity. A lot reads slightly over 100% assay but shows a measurable impurity peak. The reference standard’s own purity, or a slightly generous response factor, likely accounts for the gap.
- Low assay, high purity. A lot reads below 100% assay yet shows high purity percentage. Residual water, salt content, or a minor isomer can shave points off potency without showing up as an “impurity” in the chromatographic sense.
When the numbers disagree in ways that don’t make sense, work through a short checklist before flagging the batch:
- Re-run the reference standard and confirm its certified value hasn’t drifted.
- Check peak integration settings, especially baseline and threshold parameters that can inflate or shrink area percent.
- Verify the response factor used in the calibration calculation.
- Run an orthogonal method, qNMR or LC-MS, to confirm whether the discrepancy is real or an artifact.
Document every step. A discrepancy that affects release needs a written rationale, not just a corrected number.
What Assay and Purity Mean for QC and Batch Release
Regulatory frameworks treat assay and impurities as separate specifications on purpose. A batch that meets its assay spec can still get held if an unidentified impurity exceeds its qualification threshold, and that split accounts for a lot of confusion among researchers new to release testing.
- Impurity limits often carry more weight in a hold decision than a minor assay deviation, because an unknown impurity carries unknown risk.
- Root-cause investigations after a purity failure typically start with re-testing, then move to raw material review, process deviation checks, and analytical method review before anyone touches the batch disposition.
- Traceable reference materials and CoAs establish the measurement confidence behind both numbers. Without a properly characterized standard, an assay result is just a number with no anchor.
- Measurement uncertainty should accompany both values, not just purity, so release decisions account for the method’s own variability rather than treating a single result as absolute.
Practically speaking, unidentified impurities tend to trigger longer investigations and more disruption to shipping timelines than a small potency miss, since a supplier can often explain an assay deviation with a calibration note, but an unknown peak requires actual identification work.
Choosing and Validating the Right Tests: A Practical Checklist
Deciding what to run comes down to what question you’re actually asking. Here’s a sequence that holds up across most peptide and small-molecule QC workflows.
- Start with assay alone for incoming raw material screening when the supplier already provides a validated purity CoA.
- Run assay plus purity together for release testing on any lot going into further research use, since potency and cleanliness both drive downstream results.
- Escalate to expanded impurity profiling (LC-MS identification, ICP for elementals) when a purity result flags an unknown peak above the reporting threshold.
- Match validation elements to the test type: specificity, linearity, accuracy, precision, LOD/LOQ, robustness, and system suitability all apply, but weighted differently for assay versus purity work, following the structured method-selection framework used in clinical and analytical labs.
- Confirm the CoA carries the essentials: method ID, reference standard lot, measurement uncertainty, test date, batch or lot number, and analyst initials.
Sample handling errors bias results more often than instrument problems do. Inconsistent injection volumes, integration baselines set inconsistently across runs, and standards prepared at slightly different concentrations all introduce variability that looks like a real analytical difference but isn’t.
Pro Tip: Keep your integration parameters locked and documented across a method’s lifecycle. A single analyst adjusting baseline thresholds “to get a cleaner peak” is one of the most common, and least discussed, sources of assay-purity discrepancy in small labs.
Why Transparency in Assay and Purity Reporting Actually Matters
Most suppliers report a single purity number and call it done. That’s a quality transparency gap some suppliers have struggled with, where assay and purity data are not fully documented separately on every CoA. Reproducibility in research depends on knowing exactly what method generated a number and how much uncertainty rides along with it.
We encourage researchers to ask suppliers directly for method details, reference standard traceability, and measurement uncertainty. If a supplier can’t answer those questions, that’s worth noting. Technical support teams are sometimes available to assist with assay or purity questions on product lots before ordering.
— Data Peptides
Getting Research-Grade Materials With Verified Assay and Purity Data
Reading a CoA is only useful if the CoA behind it is actually trustworthy. Data Peptides publishes third-party Certificates of Analysis showing both assay and purity results for its research-grade lots, so you can check the numbers before you commit to a batch instead of taking a label claim on faith. Every product page, including lots like SS-31, links back to its own testing documentation.
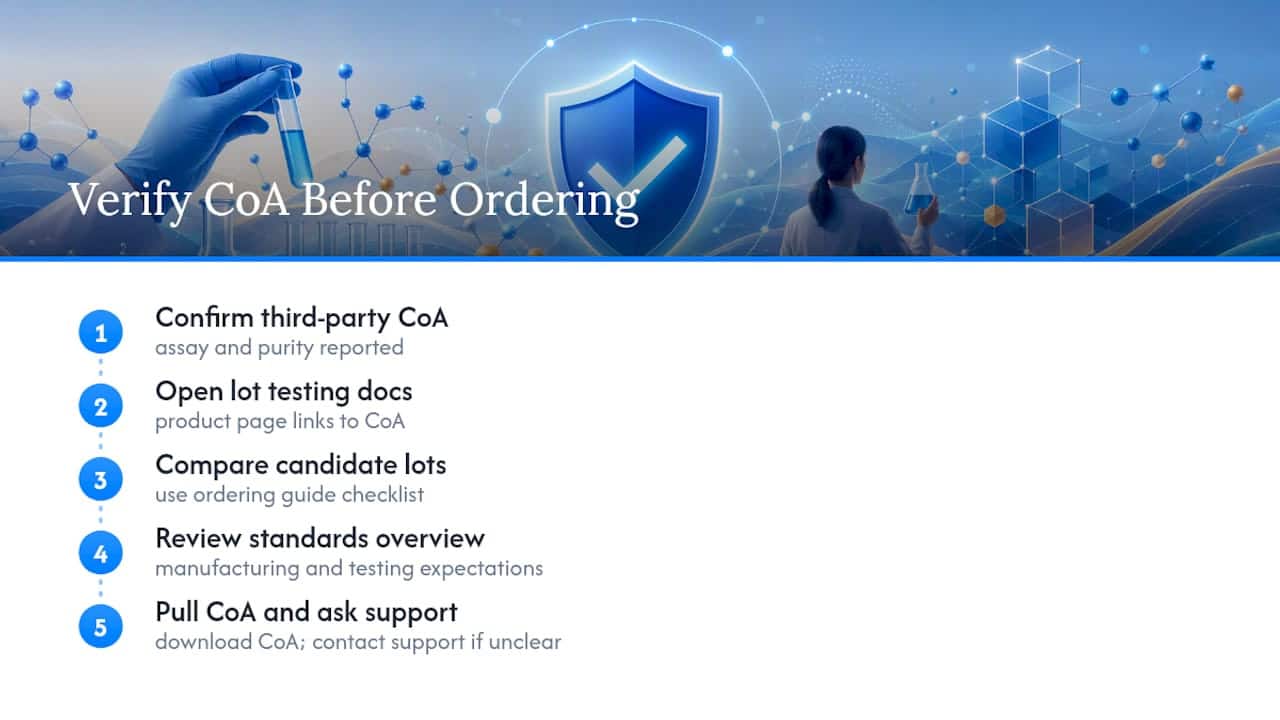
If you’re setting up a new order and want to compare lots side by side, the ordering guide for researchers walks through what to check on a CoA before checkout, including reference standard information and reporting units. Data Peptides also maintains a research standards overview covering the manufacturing and testing expectations behind each lot. Support teams may be available to address questions about CoAs. Browse the current shop and pull the CoA for any lot before you order.
Sources
FAQ
What is the difference between assay potency and purity?
Assay potency measures how much active compound is present relative to a reference standard, while purity measures the fraction of the sample that is free of impurities, using a mass-balance or direct measurement like qNMR.
What does “assay” mean in a lab testing context?
An assay is a test that determines the concentration, potency, or activity of a specific target compound, using formats ranging from HPLC and titration to functional bioassays like ELISA.
What is the difference between assay and potency?
Potency usually refers to the biological or functional activity of a compound, often measured by bioassay, while assay is the broader term covering any method used to quantify a target, chemical or functional.