

Peptide impurities fall into two broad categories: peptide-related (sequence variants, truncations, aggregates) and non-peptide-related (residual solvents, protecting-group fragments, elemental contaminants). The central concern is not purity percentage alone. Even trace peptide-related impurities can alter immunogenicity and complicate regulatory comparability, which is why FDA guidance and Ph. Eur. thresholds now call for orthogonal analytical methods rather than a single purity number.
TL;DR:
- For certain ANDAs referencing recombinant DNA origin drugs, FDA calls for risk characterization of impurities at 0.10% to 0.5%; levels above 0.5% require stronger justification.
- Pair HPLC purity testing with mass spectrometry: chromatography separates peaks, while accurate mass and targeted fragmentation help identify unknowns and distinguish deletions from substitutions.
- Before use, confirm mass identity, HPLC method and purity, assay content, counterion and water content, residual solvents, endotoxin, batch number, and an independent lab signature.
- Treat computational epitope flags as prompts for follow up, then combine HLA binding, T cell assays, or MAPPs because prediction alone cannot establish immune response.
Table of Contents
- What Are Peptide-Related and Non-Peptide Impurities?
- How Do Synthesis, Processing, and Storage Create Impurities?
- Which Analytical Methods Detect and Identify Peptide Impurities?
- What Regulatory Thresholds Apply to Peptide Impurities?
- How Do You Assess Immunogenicity Risk From Impurities?
- What Should a Peptide COA Checklist Cover Before Use?
- How Do Impurity Differences Affect Comparability and Submissions?
- What Does a Credible Peptide Quality Program Look Like?
- Where Is Peptide Impurity Science Heading?
- Where Can Researchers Find Documented, Third-Party Tested Peptides?
- FAQ
- Sources
What Are Peptide-Related and Non-Peptide Impurities?
Impurity classification shapes how a lab reports, investigates, and qualifies an unknown peak. The distinction matters because peptide-related impurities tend to carry higher immunogenicity risk, while non-peptide impurities more often raise toxicology or manufacturing concerns.
Peptide-related impurities share structural similarity to the target sequence. They arise during synthesis or storage and include:
- Deletion and truncation sequences, where one or more residues are missing from incomplete coupling steps.
- Insertion or substitution variants, where an incorrect amino acid is added or swapped during synthesis.
- Epimerized residues, where a stereocenter inverts from L- to D-configuration during activation or coupling.
- Oxidized forms, common at methionine, tryptophan, and cysteine residues exposed to air or light.
- Aggregates and high molecular weight species, formed through non-covalent association or disulfide mismatching.
Non-peptide impurities are chemically distinct from the target sequence. They include residual solvents like dimethylformamide or acetonitrile left over from solid-phase synthesis, protecting-group fragments such as tert-butyl or fluorenylmethyloxycarbonyl byproducts that failed to fully cleave, elemental impurities introduced by metal catalysts or reagents, and extractables or leachables that migrate from storage containers and tubing during manufacturing or formulation.
Of these, peptide-related impurities, particularly deletion sequences, insertions, and racemized residues, most commonly affect immunogenicity. A review of product-related risk factors points to insertions, deletions, substitutions, and racemization, along with beta-alanine contaminants, as impurity types capable of modulating immune response, though confirming actual clinical impact typically requires combined in vitro and in silico assessment rather than structure alone.
How Do Synthesis, Processing, and Storage Create Impurities?
Most impurities trace back to a specific point in the manufacturing or handling chain. Mapping impurity type to its likely origin speeds root-cause investigation and informs where to add in-process controls.
Solid-phase peptide synthesis generates its own characteristic failure modes. Incomplete coupling at any cycle produces a deletion sequence one residue shorter than the target. Failed deprotection leaves a protecting group attached, producing a mass-shifted impurity that LC-MS screening typically catches. When capping steps acetylate unreacted amine termini rather than allowing a free N-terminus, acetylated truncated fragments accumulate, which is why many synthesis protocols include a deliberate capping step to convert failed couplings into easily separated byproducts rather than carrying them forward.
Side reactions during coupling and deprotection introduce a second impurity class:
- Epimerization occurs when base-mediated activation inverts a chiral center, most often at histidine or cysteine.
- Oxidation affects methionine, tryptophan, and cysteine during synthesis, workup, or extended exposure to ambient oxygen.
- Protecting-group adducts form when a scavenger fails to fully trap a reactive cation released during trifluoroacetic acid cleavage.
- Racemization at the C-terminal residue during resin cleavage under strongly acidic or basic conditions.
Storage and formulation introduce a third category that develops after synthesis is complete. Peptides prone to aggregation can form dimers, oligomers, or visible particulates under freeze-thaw cycling or prolonged room-temperature storage. Deamidation converts asparagine or glutamine residues to aspartate or glutamate over time, shifting both mass and charge. Peptides containing multiple cysteines are vulnerable to disulfide scrambling if redox conditions during folding or storage are not controlled. Extractables from vial stoppers, syringe plungers, or tubing can migrate into solution during extended contact, adding non-peptide impurities that were never part of the original synthesis.
Which Analytical Methods Detect and Identify Peptide Impurities?
No single method confirms both purity and identity, which is why regulators and experienced labs rely on orthogonal workflows: independent methods based on different physical or chemical principles that cross-check each other’s results.
High-performance liquid chromatography (HPLC) remains the backbone for purity reporting. Reversed-phase HPLC with UV detection separates the target peptide from closely related impurities and reports percent purity by peak area, but it cannot confirm the identity of an unknown peak on its own. Two co-eluting species with similar retention times can masquerade as a single clean peak.
Liquid chromatography coupled to mass spectrometry (LC-MS) or high-resolution mass spectrometry (LC-HRMS) closes that gap. Accurate mass measurement confirms whether a separated peak matches the expected molecular formula, and peptide mapping, where the peptide is enzymatically digested into smaller fragments before MS analysis, localizes a modification to a specific residue rather than just flagging a mass shift somewhere in the sequence.
Beyond routine identity confirmation, several more targeted assays address specific impurity concerns:
- Targeted MS/MS fragmentation sequences an impurity peak directly, distinguishing a deletion from a substitution of similar mass.
- MHC-Associated Peptide Proteomics (MAPPs) identifies which fragments of a peptide or impurity are naturally processed and presented by antigen-presenting cells.
- HLA-binding assays measure whether a candidate sequence binds human leukocyte antigen molecules strongly enough to warrant T-cell follow-up.
- In silico epitope screening scans sequences computationally for motifs resembling known T-cell epitopes before committing to wet-lab assays.
Running HPLC and LC-MS in parallel, rather than relying on either alone, substantially reduces the risk that a co-eluting or isobaric impurity escapes detection. The EMA guideline on synthetic peptides explicitly recommends complementary techniques, including mass spectrometry and orthogonal chromatography, to fully characterize impurity profiles and to monitor high molecular weight species and epimerization that a single method might miss.
Method validation for impurity detection follows the same core principles as any quantitative assay, adapted to low-level analytes. Limit of detection (LOD) and limit of quantitation (LOQ) must be established well below the reporting threshold the lab intends to use, specificity must be demonstrated against the matrix and known related substances, and spike-and-recovery experiments confirm that a known amount of impurity added to a sample is accurately recovered by the method. Forced-degradation studies, deliberately stressing a sample with heat, light, or pH extremes, help confirm that a method can detect the degradation products most likely to appear over shelf life.
Pro Tip: Run LC-MS and HPLC on the same sample preparation, not separate dilutions, so any discrepancy between the two traces back to the method rather than to sample handling.
What Regulatory Thresholds Apply to Peptide Impurities?
Regulatory thresholds give QC teams a defensible line between “monitor” and “characterize.” Two frameworks dominate current practice, and they do not fully overlap.
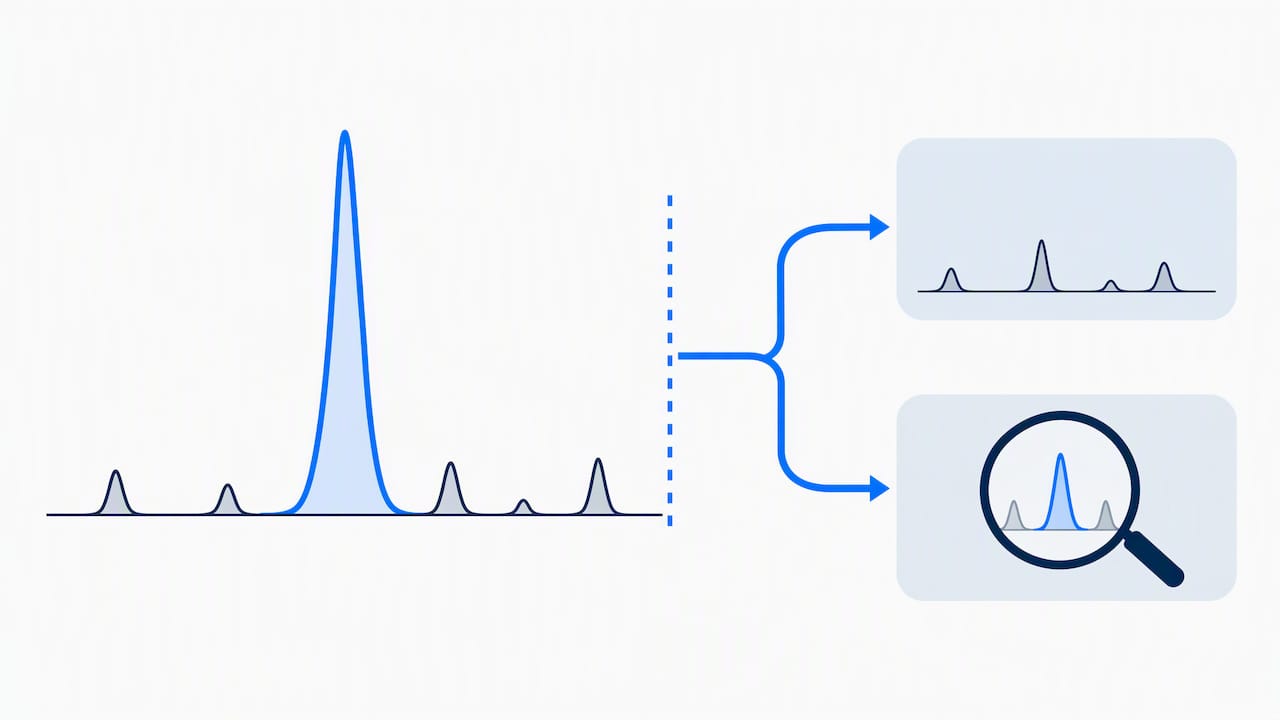
The FDA’s 2021 guidance on highly purified synthetic peptide drug products that reference listed drugs of recombinant DNA (rDNA) origin ties impurity levels directly to immunogenicity risk assessment. New impurities present at 0.10% to 0.5% of the drug substance should be characterized for immunogenicity risk using orthogonal methods, and impurities above a low threshold raise greater concern requiring more extensive justification. This guidance applies specifically to certain ANDA submissions for peptides referencing rDNA-origin listed drugs, not as a universal rule for every synthetic peptide.
The European framework, set out in the EMA guideline on synthetic peptides and reflected in Ph. Eur. general chapters, uses a tiered threshold system:
- Report any impurity present above a low threshold.
- Identify the structure of any impurity present at a moderate threshold.
- Qualify the safety of any impurity present at a higher threshold.
These thresholds apply to the Ph. Eur. framework for synthetic peptide substances and are distinct from the FDA’s ANDA-specific immunogenicity window, though both converge on the same practical point: impurities well under 1% can still require investigation.
ICH Q3A and Q3B, the guidelines that set toxicology-based qualification thresholds for small-molecule drug substances and products, were not written with peptides in mind, and peptides are often excluded from their direct scope. In practice, this means manufacturers cannot simply import Q3A/Q3B thresholds wholesale. Instead, sponsors typically justify peptide-specific impurity controls using a combination of batch analysis history, stability data, and, where immunogenicity is plausible, orthogonal risk assessment rather than a generic toxicological threshold of concern.
Regulatory dossiers built around these thresholds typically include annotated chromatograms showing each detected impurity, an impurity table listing identity, level, and classification (peptide-related versus non-peptide-related), and orthogonal assay data supporting any immunogenicity characterization claimed for impurities in the 0.1% to 0.5% range or above.
How Do You Assess Immunogenicity Risk From Impurities?
Immunogenicity risk assessment for impurities follows an escalation logic: start computationally, confirm experimentally, and never rely on a single assay type to close the question.
In silico tools screen a peptide or impurity sequence against known HLA-binding motifs to predict whether it contains a potential T-cell epitope. A flagged sequence does not confirm actual immunogenicity. It indicates structural similarity to known binding motifs and signals that experimental follow-up is warranted, since binding prediction alone cannot account for whether the sequence would actually be processed, presented, and recognized by a T-cell receptor in vivo.
In vitro approaches provide that experimental layer and include several complementary assay types:
- Naive donor CD4+ T-cell assays expose T cells from multiple healthy donors to the candidate impurity and measure proliferation or cytokine release as a proxy for immune activation.
- HLA-binding assays directly measure whether a peptide binds purified HLA class II molecules with affinity sufficient to support antigen presentation.
- MAPPs analysis confirms whether a sequence is naturally processed and displayed on antigen-presenting cells rather than only binding HLA in a simplified biochemical assay.
A 2023 review on immunogenicity risk assessment describes combining in silico screening tools such as EpiMatrix and JanusMatrix with naive T-cell assays as a practical orthogonal approach, citing the PANDA framework as one example of this workflow applied to generic peptide support. The orthogonality requirement matters because in silico prediction and in vitro T-cell response rely on different scientific principles. Agreement between the two carries far more weight than either result alone, and disagreement flags a sequence that needs closer scrutiny rather than a quick dismissal.
Experimental evidence from commercial peptide impurity studies underscores why this escalation matters even at low levels.
A defensible immunogenicity risk report for impurities typically documents the in silico screening method and flagged sequences, the in vitro assay type and donor panel used for confirmation, the orthogonal rationale connecting the two methods, and a final risk classification tied back to the impurity’s measured level in the drug substance.
Pro Tip: Treat an in silico epitope flag as a trigger for in vitro testing, not as a standalone conclusion. A sequence match without experimental confirmation is a hypothesis, not a finding.
What Should a Peptide COA Checklist Cover Before Use?
A usable Certificate of Analysis answers specific questions, not just “is this pure.” Before releasing material for a study, run through this sequence:
- Confirm identity by comparing the observed mass from LC-MS against the theoretical mass for the intended sequence.
- Check HPLC purity and verify the COA states the method, column, and gradient used, since a bare percentage without method details cannot be interpreted.
- Verify assay content in milligrams, which reflects actual peptide mass rather than relative purity by peak area alone.
- Review counter-ion and water content, both of which affect how much actual peptide mass a given vial contains.
- Check residual solvent and endotoxin results, particularly for material intended for sensitive cell-based or animal work.
- Confirm a third-party lab signature and batch number tying the COA to a specific, traceable lot.
Purification choices involve real tradeoffs. Preparative reversed-phase HPLC remains the workhorse for removing closely related sequence variants, but tighter purity cuts generally reduce recovery, so a 99% purity target costs more material per gram than a 95% cut. Orthogonal polishing steps, running a second purification mode with a different separation mechanism, catch impurities the primary method cannot resolve, at the cost of additional processing time and yield loss.
Eur. guidance, and confirm it with spike-and-recovery data rather than assuming the instrument’s default sensitivity is adequate. Forced-degradation studies under heat, light, and pH stress help confirm the method catches realistic degradation products, not just synthetic byproducts.
Any one of these gaps means the material’s actual quality cannot be verified from the paperwork alone.
Pro Tip: Request the raw chromatogram, not just the summary purity number. A clean-looking percentage can hide a shoulder peak that a summary table rounds away.
How Do Impurity Differences Affect Comparability and Submissions?
Impurity profile differences carry direct consequences for generic and follow-on peptide development, particularly under the ANDA and 505(b)(2) pathways.
For ANDAs referencing listed peptide drugs of rDNA origin, the FDA’s 2021 guidance makes clear that a new or elevated impurity relative to the reference product can trigger additional characterization requirements, since impurity differences are treated as a potential driver of differential immunogenicity rather than a purely cosmetic quality distinction. A 505(b)(2) application, which relies in part on existing safety data for a related product, faces similar scrutiny whenever its impurity profile diverges from the referenced product.
Impurity differences require additional toxicology or immunogenicity data when the new or elevated impurity falls in or above the characterization window, when it belongs to a structural class known to carry immunogenicity risk such as insertions or racemized residues, or when stability data shows the impurity increasing over shelf life rather than remaining static. Sponsors typically justify tighter or looser controls using batch analysis trends across multiple lots alongside stability data under intended storage conditions.
A complete comparability package generally includes impurity tables listing each species by level and identity, annotated chromatograms from both HPLC and orthogonal LC-MS runs, immunogenicity risk assessment outputs where applicable, and a written mitigation plan describing how the manufacturing process controls the impurity going forward.
What Does a Credible Peptide Quality Program Look Like?
A COA that supports real regulatory or research use covers the same core elements every time: identity confirmed by observed versus theoretical mass, HPLC method and purity result, assay content in milligrams, counter-ion and water content, residual solvent and endotoxin data, a batch number, and a signature from the testing lab.
- Independent third-party testing, rather than in-house-only verification, gives outside reviewers a basis for trusting reported purity and identity.
- Accessible, complete COAs let a receiving lab reproduce or sanity-check results without requesting additional documentation after the fact.
- Endotoxin data matters even for non-injectable research use, since contaminated material can confound cell-based assay readouts.
- Batch-specific documentation, rather than a generic specification sheet, is what ties a COA to the actual vial in hand.
Where Is Peptide Impurity Science Heading?
The next few years will likely bring tighter integration between in silico and in vitro immunogenicity workflows. Prediction tools are improving, but the 2025 review in the Journal of Peptide Science is right to flag that standardized orthogonal testing, not better software alone, is what the field still lacks. Different labs running different assay combinations on the same impurity can reach different risk conclusions, and that inconsistency is a bigger practical problem than any single method’s sensitivity.
My honest read: purity percentage is the least informative number on most COAs. Researchers should prioritize orthogonal detection early in any protocol, not as an afterthought once a result looks odd, and should treat an incomplete COA as a reason to ask questions, not a formality to file away.
— Data Peptides
Where Can Researchers Find Documented, Third-Party Tested Peptides?
Sourcing material with a complete, verifiable COA saves time that would otherwise go into chasing down missing method details after the fact. Our shop lists research peptides across weight loss, muscle growth, recovery, anti-aging, and libido categories tied to batch testing and endotoxin data. We also publish separate guidance on buying research peptides online and on US-made peptide quality standards so researchers can see examples of testing packages before placing an order. For researchers comparing supplier COA practices more broadly, Peppy&Me’s overview of research-use-only classifications is a useful external reference point.
This article is general information, not a substitute for advice from a qualified doctor. Consult a qualified healthcare professional about your own circumstances before acting on anything here.
FAQ
How Can You Tell if Peptides Are Pure?
Check the Certificate of Analysis for HPLC purity with stated method details, an LC-MS identity confirmation matching observed to theoretical mass, and assay content in milligrams rather than relying on a purity percentage alone. A credible COA also lists counter-ion and water content, residual solvents, and a third-party lab signature tied to a specific batch number.
What Destroys Peptides?
Peptides degrade through oxidation at methionine, tryptophan, and cysteine residues, deamidation of asparagine or glutamine over time, and aggregation driven by freeze-thaw cycling or prolonged room-temperature storage. Disulfide scrambling in multi-cysteine peptides and exposure to extreme pH or heat during handling also break down structure and biological activity.
What Are the Two Main Types of Peptide Impurities?
The two main categories are peptide-related impurities, such as deletion sequences, insertions, substitutions, and oxidized or epimerized residues, and non-peptide impurities, such as residual solvents, protecting-group fragments, and elemental contaminants. Peptide-related impurities carry the greater immunogenicity risk concern since they structurally resemble the target sequence.
How Do You Purify Synthetic Peptides?
Preparative reversed-phase HPLC is the standard method for removing closely related sequence variants, with tighter purity targets generally trading off against recovery yield. Many labs add an orthogonal polishing step using a different separation mechanism to catch impurities the primary purification cannot resolve.
What Impurity Level Requires Immunogenicity Characterization?
Under FDA guidance for certain highly purified synthetic peptide ANDAs, new impurities at low proportions of the drug substance should be characterized for immunogenicity risk, and levels above 0.5% raise greater concern. The Ph. Eur. framework uses a tiered threshold system.
Sources
- ANDAs for Certain Highly Purified Synthetic Peptide Drug Products That Refer to Listed Drugs of rDNA Origin (FDA, 2021)
- Guideline on the development and manufacture of synthetic peptides (EMA)
- Immunogenicity of therapeutic peptide products: bridging the gaps regarding the role of product-related risk factors (PMC review)
- Immunogenicity risk assessment of synthetic peptide drugs and their impurities (De Groot et al., 2023)