
HPLC peptide purity is a chromatographic area percentage: the share of the detected signal that belongs to the main peak, measured under one specific method. It tells you how clean the detected material is. It does not tell you what the peptide is, how much peptide is in the vial, or whether it does anything in your assay. This guide shows how the number is produced, how to read the chromatogram behind it, and how to check a certificate of analysis (CoA) before a lot goes into your work. Everything here concerns laboratory research use only.
TL;DR
- HPLC purity is the main peak’s area divided by the total integrated peak area, expressed as a percentage, under a defined method.
- It is a relative figure. A 99% result does not mean 99% of the vial is peptide, because water, counter-ions and undetected material sit outside the calculation.
- Identity needs a separate test, usually mass spectrometry. Quantity needs an assay or a content determination.
- Two purity numbers are only comparable when the column, gradient, wavelength and integration rules match.
- A useful CoA is batch-specific, shows the chromatogram, names the method and pairs HPLC with identity data.
Table of Contents
- What HPLC purity actually measures
- How the percentage is calculated
- Reading a peptide chromatogram
- What a 99% result leaves out
- Peak purity versus HPLC purity
- Why two 99% results can disagree
- How to verify a purity claim on a CoA
- Our perspective
- Choosing documented lots
- FAQ
- Sources
What HPLC purity actually measures
High-performance liquid chromatography pushes a dissolved sample through a packed column with a liquid mobile phase. Different molecules travel at different speeds, so they reach the detector at different times. For synthetic peptides the usual format is reversed-phase HPLC, with a gradient that slowly increases the organic solvent so that more strongly retained species come off later.
The detector records a signal over time. Each separated component appears as a peak. The time from injection to the top of a peak is its retention time, and the area under the peak is integrated by the chromatography data system, as Waters explains in its introductory primer. Area is what represents how much of that component was detected.
For peptides, the detection wavelength is commonly 214 nm, where the amide bonds along the backbone absorb. The method write-up from Compound Evidence stresses that parameters such as column type, gradient slope and wavelength must be clearly defined so results are reproducible and comparable. That sentence is the key to everything below: a purity figure belongs to a method, not to a molecule.
How the percentage is calculated
The calculation is area normalization:
Purity (%) = main peak area ÷ sum of all integrated peak areas × 100
A worked example, with invented numbers for illustration:
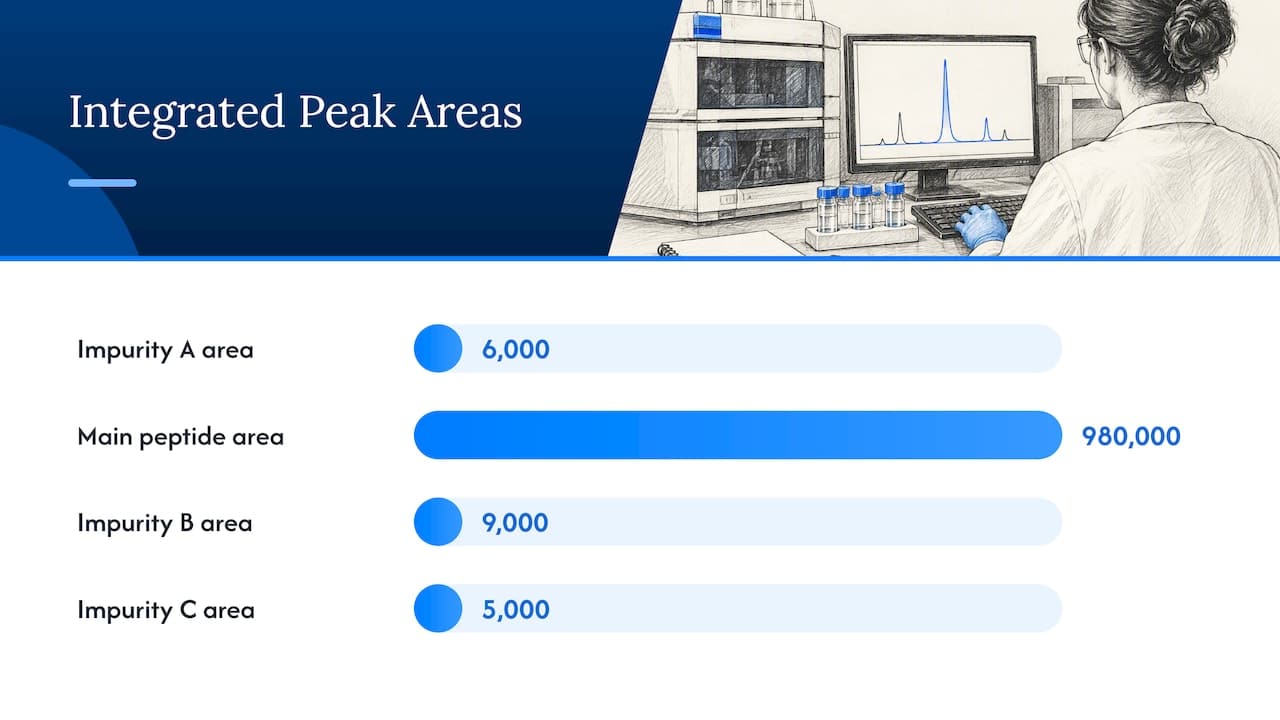
| Peak | Retention time (min) | Area |
|---|---|---|
| Impurity A (early) | 11.8 | 6,000 |
| Main peptide | 14.2 | 980,000 |
| Impurity B (late) | 16.5 | 9,000 |
| Impurity C | 17.1 | 5,000 |
| Total | 1,000,000 |
The main peak is 980,000 of 1,000,000, so the reported purity is 98.0%. Nothing in that arithmetic says how many milligrams of peptide were injected. It only says that of the signal the detector saw, 98% came from the main peak.
Three choices quietly change the answer:
- Where the baseline is drawn. Integration settings decide which small bumps count as peaks. Peak area integration can be subjective without defined processing methods, a point made in a Waters application note on peptide impurity tracking.
- Whether the solvent front and blank peaks are excluded. A good report subtracts them.
- Which reporting threshold applies. Impurities below a cutoff may simply not be listed.
Reading a peptide chromatogram
When a CoA includes the trace, you can check the number yourself in about a minute.
- Find the main peak. It should be the dominant, symmetric peak. Shoulders, split tops or a long tail suggest co-eluting material or a column problem.
- Check the retention time. Identification by retention time only works against a standard run under the same conditions, which is the logic Waters describes in its primer linked above. A retention time alone, with no reference, does not prove identity.
- Look at the small peaks. Early peaks are often more polar fragments or truncated sequences. Late peaks are often more hydrophobic species, such as incompletely deprotected products. Their sizes should roughly add up to the stated impurity total.
- Check the axes and the baseline. A y-axis zoomed so the main peak is clipped can hide or exaggerate the small peaks. A noisy, drifting baseline makes the integration less trustworthy.
- Read the method line. Column, mobile phases, gradient, flow rate, wavelength and run time should be stated. If they are not, the number is a bare claim.
What a 99% result leaves out
This is where most misreadings happen.
Purity is not peptide content
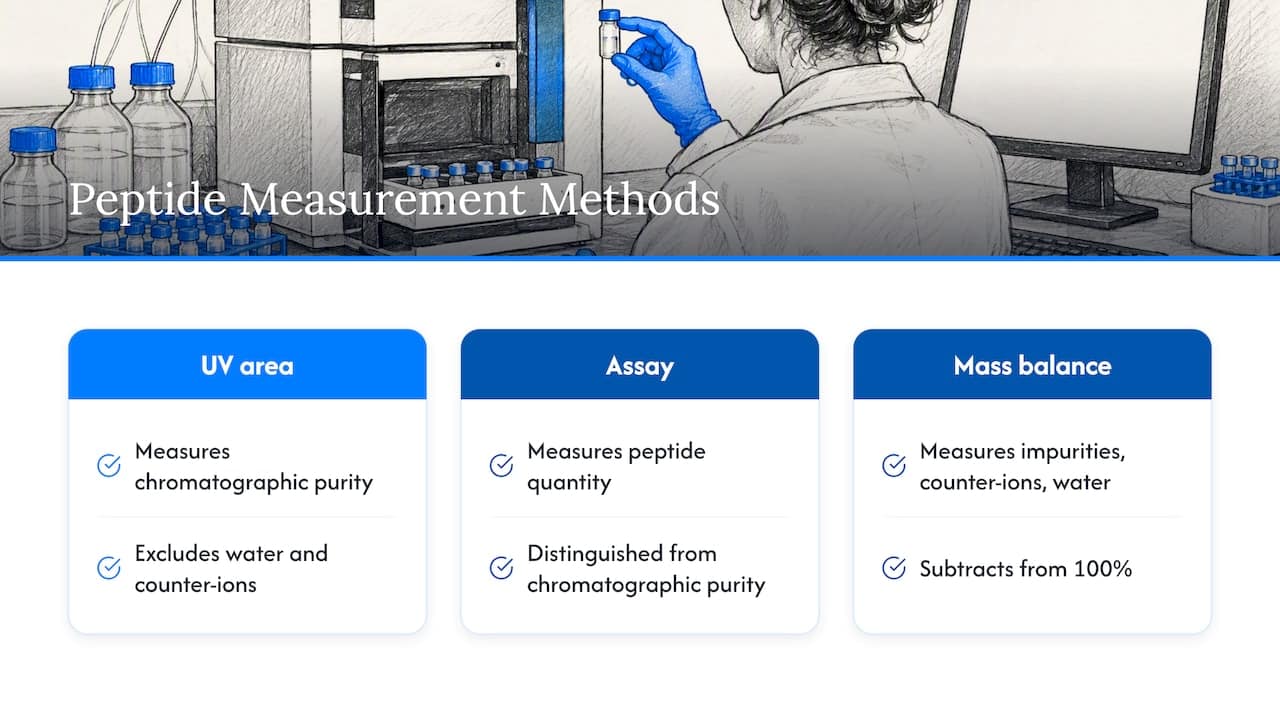
A lyophilized peptide is not pure peptide. It carries water and counter-ions, commonly trifluoroacetate or acetate from synthesis and purification. Neither is counted in a UV area percentage. The USP document on reference standards for synthetic peptide quality distinguishes chromatographic purity from strength (assay), which measures the quantity of peptide. It also describes a mass balance approach, where impurities, counter-ions and water are measured and subtracted from 100%, as a benchmark for establishing the true purity and content of bulk synthetic peptide.
The practical consequence: a vial labeled 10 mg with 99% HPLC purity can contain noticeably less than 9.9 mg of peptide. We go through the arithmetic in our piece on why 99% purity can hide a gap in peptide content, and in what it means when assay runs over 100% while purity sits under 98%.
Purity is not identity
A sharp, single peak shows that something is clean. It does not show that the something has the right sequence. A wrong peptide can chromatograph beautifully. Identity is usually confirmed by mass spectrometry, which measures molecular mass. FDA regulatory science work has used LC-MS/MS to screen for and identify peptide impurities, including some that co-eluted with the main active peak, as reported in the FDA’s regulatory science report on complex mixtures and peptides. Co-elution is precisely what UV-only purity cannot expose. For the practical side, see LC-MS for peptides: how it works and what to check.
Purity is not activity
Neither HPLC nor mass spectrometry says whether the peptide folds, binds or behaves correctly in your system. They are quality-control tools, not functional assays.
Peak purity versus HPLC purity
The phrase “peak purity” causes confusion because it means something different from the percentage on a CoA. Peak purity asks whether a single peak contains one compound. Diode-array software compares UV spectra across the peak with the spectrum at the apex. Per Waters’ application note on spectral purity, matching spectra support spectral homogeneity, while changing spectra point to possible coelution or more than one component.
There is a ceiling on what this proves. LCGC’s review of peak purity cautions that a high spectral match can still occur when an impurity is present at low level, has a similar spectrum, or coelutes with the principal compound. Peptide impurities, such as a deletion sequence missing one residue, are often exactly that: spectrally almost identical to the target. So a passing peak-purity check is evidence, not a guarantee.
As for the “P2 and P3” some readers search for, these are not standard peptide-purity terms. They are typically instrument or software-specific labels, so look in the report’s method or legend to see what a given lab means by them.
Why two 99% results can disagree
Suppose two labs test the same lot. One reports 99.2%, the other 97.8%. Neither is necessarily wrong. Reasons include:
- Different gradients. A steep gradient compresses the run and may merge a minor impurity into the main peak. A shallow one can separate it and lower the percentage.
- Different columns or mobile-phase modifiers. Selectivity changes which impurities resolve.
- Different wavelengths. 214 nm sees the backbone. 280 nm favors aromatic residues and can miss impurities without them.
- Different integration rules. Peak-picking thresholds and baseline handling move small peaks in or out.
- Different sample handling. Degradation after dissolution can create new peaks.
So comparing 99.2% with 99.8% from different labs says little. Within the same lab and method, across lots, the same difference can be meaningful. The comparison is only fair when the method is held constant.
How to verify a purity claim on a CoA
Run a CoA through these checks before trusting it.
- Is it batch-specific? The lot number on the document must match the lot number on your vial. A generic certificate for the product line proves nothing about your lot.
- Is the chromatogram included? A number without a trace cannot be examined.
- Is the method stated? Look for column, gradient, wavelength and run conditions.
- Is identity confirmed separately? Expect a measured mass compared with the theoretical mass.
- Does it address content? If you dose by weight, you need net peptide content or an assay figure, not only area percent.
- Who ran it? An independent laboratory, with its name and date on the report, carries more weight than a self-issued statement.
- Are impurities and endotoxin data reported where relevant? Cell-based work in particular needs endotoxin information.
Our research peptide safety checklist condenses this into three checks before a lot enters an assay, and our guide to peptide impurity thresholds explains how reporting cutoffs in the 0.10 to 0.5% range change what a researcher can see. If you are budgeting a purchase, the pricing guide shows how to compare cost per milligram of actual peptide instead of per labeled milligram.
Our perspective
We sell peptides for laboratory research, and we think a purity number is only as good as the documents behind it. A bare “99%” in a product title is marketing. A chromatogram, a stated method, an identity result and a lot number you can match to your vial are evidence.
That is why every lot we list is third-party batch tested for purity and identity, and why we publish Certificates of Analysis and endotoxin data for each lot. We also think buyers should ask us the harder questions: what is the net peptide content, which method was used, and can you see the trace? A supplier that welcomes those questions is easier to work with than one that deflects them. Our broader research peptides guide and ordering guide are written with the same view.
— Data Peptides
Choosing documented lots
If you are sourcing for laboratory work, start from the category that matches your project, then open the CoA for the lot you are considering. Our shop covers weight loss, muscle growth, recovery, anti-aging, libido and ancillary research supplies, all for laboratory research use only, shipped discreetly from our US facility with 24/7 support if you need help reading a document. Specific lines are on the recovery category page and the anti-aging category page.
FAQ
Is assay the same as purity?
No. Purity describes how much of the detected material is the main component, while assay (strength) measures the quantity of peptide present. USP treats the two as distinct quality attributes. A lot can show high purity and still deliver less peptide per vial than the label suggests.
How do I verify peptide purity?
Match the lot number on the CoA to your vial, then check for the chromatogram, the stated HPLC method and a mass spectrometry identity result from an independent lab. If you dose by weight, also ask for net peptide content. Re-testing a sample in your own or a contract laboratory is the strongest check.
Can HPLC measure how much peptide is in a vial?
Only with a calibrated approach. Area percent alone is relative, so it cannot give milligrams. Quantity requires a reference standard, an assay, or a mass balance that accounts for water and counter-ions.
Can I compare a 99.2% result with a 99.8% result?
Only when both came from the same method, same lab and same integration rules. Across labs, differences in column, gradient, wavelength and baseline handling can shift a result by more than that gap.
Sources
- Identifying and Quantitating Compounds Using HPLC (Waters)
- CEI-MS-01: Determination of chromatographic purity of peptides (Compound Evidence)
- LC-UV-Based Synthetic Peptide Impurity Tracking (Waters application note)
- Reference Standards to Support Quality of Synthetic Peptide Therapeutics (USP)
- FYs 2013-2017 Regulatory Science Report: Complex Mixtures and Peptides (FDA)
- Verifying Spectral Purity of a Chromatographic Peak (Waters)
- Peak Purity in Liquid Chromatography, Part I (LCGC)