

LC-MS pairs liquid chromatography, which separates a peptide sample into its components, with mass spectrometry, which weighs each component and, in tandem mode, breaks it apart to read its structure. For a lab buying or characterizing peptides, it answers the question HPLC cannot: is the main peak in this vial actually the molecule on the label? This guide covers how the technique works, how it differs from HPLC alone, what makes peptide runs go wrong, and how to read the LC-MS data on a Certificate of Analysis (COA). Everything here concerns laboratory research use only.
TL;DR
- HPLC tells you how much of a sample is the main component. Mass spectrometry tells you what that component is. A complete peptide check uses both.
- LC-MS/MS adds fragmentation data, which can verify sequence and flag modifications or impurities that share the target’s retention time.
- Peptide analysis fails in predictable ways: surface adsorption, salt and detergent contamination, and ion suppression. Most are fixable with sample prep and method design.
- Ask for lot-specific chromatograms and mass spectra, not just a purity percentage. A single number can hide a lot.
Table of Contents
- What LC-MS actually does to a peptide sample
- HPLC vs mass spec: two questions, two instruments
- Bottom-up or top-down: two LC-MS workflows
- Choosing instruments and settings
- Where peptide LC-MS runs go wrong
- Validating a quantitative LC-MS method
- How to read LC-MS data on a peptide COA
- Our perspective: documentation is the product
- Browsing research peptides with lot documentation
- A practical workflow for verifying an incoming lot
- FAQ
- Sources
What LC-MS actually does to a peptide sample
The instrument has two halves, and each one does a different job.
The liquid chromatography half pushes your dissolved sample through a column. Peptides interact with the column material differently depending on properties such as hydrophobicity, so they leave the column at different times. As one write-up of the technique puts it, the LC step separates peptides by hydrophobicity before they reach the mass spectrometer in the context of complex biological samples.
The mass spectrometry half ionizes what arrives, usually by electrospray, and sorts the ions by mass-to-charge ratio (m/z). Peptides typically pick up several charges, so a single compound shows up as a ladder of peaks (for example, +2, +3 and +4 charge states). Software then deconvolutes that ladder into a molecular mass you can compare against the theoretical mass of the intended sequence.
In tandem mass spectrometry (MS/MS), the instrument selects one ion, fragments it, and measures the pieces. Collision-induced dissociation has been the most widely used fragmentation technique in proteomics, and the fragment pattern lets you read sequence information and locate post-translational modifications.
Why UV detection alone is not enough
A standard HPLC run with a UV detector sees anything that absorbs light and elutes at a given time. It cannot tell two compounds apart if they co-elute, and it has limited sensitivity for trace species. Reviews of peptide bioanalysis describe LC-MS as the preferred tool for complex samples because it distinguishes peptides by m/z and by their fragmentation patterns, which UV cannot do.
HPLC vs mass spec: two questions, two instruments
People searching for HPLC versus mass spec often treat them as rivals. They are better understood as answers to different questions.
| HPLC (UV) | Mass spectrometry | LC-MS/MS | |
|---|---|---|---|
| Main question | How pure is the main component? | What is its molecular mass? | What is its sequence, and what are the impurities? |
| Typical output | Chromatogram with peak areas, purity % | Mass spectrum, observed vs. theoretical mass | Fragment spectra, sequence coverage |
| Blind spot | Cannot confirm identity | Does not give reliable purity on its own | Longer method development, more expertise |
One testing-lab comparison reports that HPLC typically quantifies purity with roughly ±1–2% accuracy, while ESI mass spectrometry confirms identity to about ±0.5 Da. The same source’s practical conclusion is the one worth remembering: HPLC alone misses a wrong-identity sequence, and MS without a purification profile struggles to quantify purity. A clean 99% peak that is the wrong compound is still the wrong compound.
A worked example of why both matter
Imagine a lot whose HPLC trace shows one dominant peak at 99.2% area. That looks excellent. Now suppose the mass spectrum shows an observed mass 16 Da above the theoretical value. That is the kind of shift an oxidation can produce on a methionine residue. The HPLC peak may have hidden it if the oxidized form eluted close to, or inside, the main peak. Only the mass data reveals it. Conversely, a lot with a perfect mass match but a chromatogram with a cluster of small peaks tells you the identity is right and the purity claim deserves scrutiny.
Bottom-up or top-down: two LC-MS workflows
If you read proteomics literature you will meet two strategies. Bottom-up (shotgun) proteomics digests proteins into peptides with an enzyme such as trypsin before analysis, while top-down analyzes intact proteins. The same review notes that bottom-up remains the most common approach and gives better depth of coverage, while top-down captures full-sequence and modification information at significantly higher analytical complexity.
For finished synthetic peptides, which are usually short, you are often analyzing the intact molecule directly, so the distinction matters less. It matters a lot if your research question involves a peptide inside a biological matrix or a protein digest. Match the workflow to the question:
- Verifying a synthetic peptide’s identity and purity: intact mass by LC-MS, plus HPLC purity, plus MS/MS if you need sequence confirmation.
- Mapping a protein or confirming a recombinant product: bottom-up digestion, then LC-MS/MS peptide mapping.
- Quantifying a peptide in plasma or tissue: targeted LC-MS/MS, usually with a stable isotope-labeled internal standard.
Choosing instruments and settings
LC-MS is a toolkit rather than a single method. Reviews of mass spectrometry for proteomics stress that instrument type, ionization method and fragmentation technique should be chosen for the specific biological question. A rough orientation:
- ESI vs. MALDI: electrospray couples directly to liquid chromatography and produces multiply charged ions. MALDI is typically run offline and favors singly charged ions.
- QTOF and Orbitrap: high-resolution instruments that give accurate mass, useful for identity confirmation and unknown impurities. Triple quadrupoles excel at targeted quantification with multiple reaction monitoring.
- CID vs. ETD: collision-induced dissociation is the workhorse. Electron-transfer dissociation tends to preserve labile modifications, which is why it is chosen for modification mapping.
No setting is universally best. A method that is ideal for quantifying a peptide at low concentration may be a poor choice for impurity profiling.
Where peptide LC-MS runs go wrong
Most bad data traces back to a short list of problems. Knowing them helps you run your own samples and judge someone else’s.
Peptides stick to everything
Peptides adsorb to glass vials, pipette tips and internal LC surfaces. The result is low recovery and non-linear calibration, especially at low concentrations. Bioanalysis reviews recommend low-adsorption plastics and careful handling. For phosphopeptides and other metal-binding species, researchers have also developed bioinertized nanoLC systems that deplete metal ions from the mobile phase, because metal contact can cause sample loss.
Salts and detergents suppress the signal
Sodium and potassium are present in every biological matrix and sometimes get added during preparation. Studies show these ions hamper electrospray ionization and reduce sensitivity, and removing them improved results in that work. SDS is another culprit: it is popular for extraction, but it interferes with reversed-phase separation and ionization, so the method has to include a removal or compatible-cleanup step.
Ion suppression hides in the chromatogram
A system can look healthy and still lose signal when a high-concentration molecule elutes at the same moment as your peptide. The standard way to see it during method development is a post-column infusion test: infuse pure analyte continuously, inject blank matrix, and watch for dips in the baseline. Then adjust the gradient so your peptide elutes outside those zones.
Carryover
Sticky peptides can show up in the blank that follows a high-concentration sample. Run blanks between samples, and treat any peak in a blank as a data-quality finding, not a nuisance.
Validating a quantitative LC-MS method
Identity and purity checks on a product are different from quantifying a peptide in a biological matrix. For the second, the reference document in the US is the FDA’s M10 guidance. It says that full validation of a bioanalytical method should assess selectivity, specificity, matrix effects, calibration curve range, accuracy, precision, carryover and stability, and it recommends a stable isotope-labeled analyte as the internal standard for MS methods where possible. It applies to chemical and biological drugs and metabolites in matrices such as serum and plasma.
If you are building a regulated workflow, the paperwork around those studies matters as much as the chemistry. A practical walkthrough of how validation records, traceability and data integrity requirements fit together in a regulated lab system can help you plan your documentation before an audit does it for you.
How to read LC-MS data on a peptide COA
This is the part that affects purchasing decisions. A COA is only as useful as the data behind it. Use this checklist when a lot arrives.
- Lot-specific identifiers. The COA should carry a batch or lot number that matches your vial, not a generic product specification.
- Both methods present. Look for an HPLC purity result and a mass spectrometry identity result. One without the other leaves the gaps described above.
- Observed vs. theoretical mass. The report should state both. A difference within the instrument’s stated tolerance supports identity. A larger gap needs an explanation.
- The chromatogram itself. A purity number is a summary. Look at the trace: baseline, number and size of minor peaks, and integration windows.
- Testing party. Third-party testing separates the seller from the measurement. Check that the lab is named and the report is dated.
- Endotoxin data where relevant. For work involving cell culture or in vivo models, endotoxin levels matter independently of purity.
Purity is not the same as peptide content
A high chromatographic purity does not tell you how much of the powder is actually peptide, because water, counter-ions such as TFA or acetate, and residual salts do not show up as peaks on a UV trace. We cover that gap in detail in our piece on why 99% purity can hide 10–40% less peptide. If you are preparing stock solutions by weight, net peptide content changes your concentration, and so your results.
What counts as an impurity worth chasing
For synthetic peptides, deletion sequences, truncations, oxidation, deamidation and racemization are the usual suspects, and LC-MS is the tool that identifies them by mass shift. Regulatory thresholds give you a sense of scale. A review of US guidance notes that the FDA’s 2021 generic peptide guidance discusses new impurities in the 0.10% to 0.5% range of the drug substance and that USP chapter <1503> addresses synthetic peptide quality without recommending specific impurity limits. Those frameworks concern drug products, not research materials, but they show how seriously small impurity fractions are taken. Our article on how the 0.10–0.5% thresholds change impurity assessment walks through what that means at the bench.
Our perspective: documentation is the product
We sell research peptides, so we are not neutral on this topic, and we would rather say so plainly. Our view is that for a lab, the vial is only half of what you are buying. The other half is the evidence that the vial contains what it says.
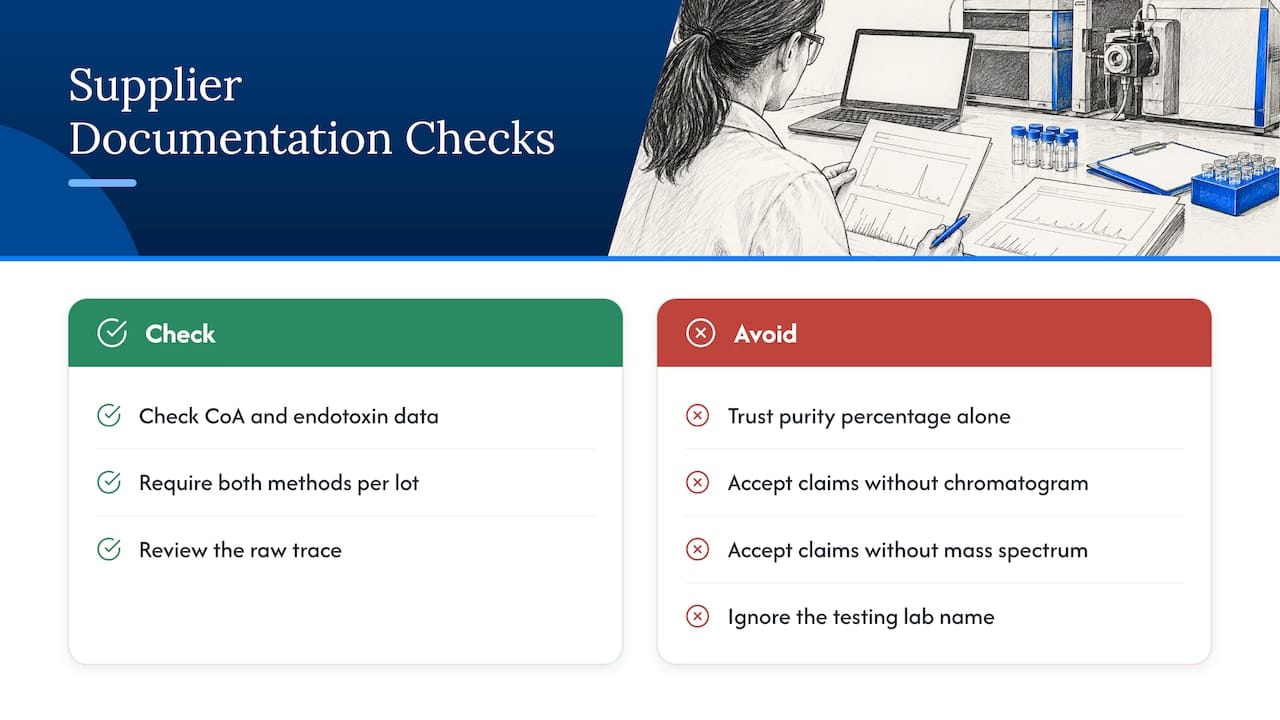
That is why we publish third-party batch testing for purity and identity, with a Certificate of Analysis and endotoxin data for every lot. When researchers ask us what to check on any supplier’s paperwork, the answer is the list above: both methods, lot-specific, with the raw trace visible. We would encourage you to hold every source, including us, to that standard.
We also think the market has a habit of treating a single purity percentage as the whole story. It is not. A number without a chromatogram, a mass spectrum and a named testing lab is a claim, not a measurement. Our products are sold for laboratory research use only, and we say that clearly because the data we publish is designed for people who will check it.
— Data Peptides
Browsing research peptides with lot documentation
If you are sourcing material for an assay and want LC-MS and HPLC documentation to compare against your own results, you can browse our research peptide catalog, which spans weight loss, muscle growth, recovery, anti-aging, libido and ancillary research categories. Each lot ships with its Certificate of Analysis, and our support team is available 24/7 if you need help locating the documentation for a specific lot. All products are for laboratory research use only, not for human or animal consumption.
If you want category-level context first, our guides on what to verify before buying recovery peptides and on matching assay tier to procurement for anti-aging peptides explain which COA checks matter most.
A practical workflow for verifying an incoming lot
If you have access to an LC-MS or a contract analytical lab, a simple verification routine looks like this.
- Plan the sample. Dissolve a small amount in a solvent compatible with your mobile phase. Use low-adsorption vials and avoid glass for dilute solutions.
- Run a blank first. This establishes your baseline and shows any carryover from previous work.
- Inject at a concentration within your detector’s linear range. Overloading distorts both peak areas and ion ratios.
- Compare the observed mass with the theoretical mass. Deconvolute the charge-state series and note any satellite peaks at mass shifts consistent with oxidation, deamidation or truncation.
- Integrate the UV trace consistently. Use the same integration parameters every time so lots can be compared fairly.
- Record everything against the lot number. If a result differs from the COA, you will want the raw files, not a summary.
A mismatch is not automatically a supplier failure. Differences in column chemistry, gradient, solvent and integration settings can shift purity numbers by a few percent. A mass mismatch, however, deserves an immediate conversation with the supplier and a retest.
FAQ
What is the difference between LC-MS and HPLC?
HPLC separates a sample and measures how much of each component is present, usually by UV absorbance. LC-MS adds a mass spectrometer as the detector, so each separated component is also weighed. That is why LC-MS can confirm identity while HPLC alone cannot.
Is mass spectrometry enough on its own to prove peptide purity?
No. Mass spectrometry confirms what a molecule is, but without a chromatographic separation it does not give a dependable purity percentage, because different species ionize with different efficiency. Laboratory guidance recommends pairing it with HPLC purity data for a complete check.
What is peptide mapping?
Peptide mapping digests a protein with an enzyme, usually trypsin, then analyzes the resulting peptides by LC-MS/MS. The pattern of fragments confirms the protein’s sequence and reveals modifications. It is the bottom-up approach described by proteomics reviews.
Why is my peptide signal low or inconsistent in LC-MS?
The usual causes are adsorption to vials and tubing, salts or detergents such as SDS in the sample, and ion suppression from co-eluting molecules. Switch to low-adsorption labware, clean up the sample, and run a post-column infusion test to find suppression zones.
Sources
- HPLC vs Mass Spectrometry for Peptide Testing
- Review: Quantitative bioanalysis of peptides by liquid chromatography coupled to (tandem) mass spectrometry
- Mass Spectrometry for Proteomics (PMC)
- Comprehensive Overview of Bottom-Up Proteomics Using Mass Spectrometry (ACS Measurement Science Au)
- Bioinertization of NanoLC/MS/MS Systems for Phosphoproteomics (PMC)
- Improved Sensitivity in HILIC-ESI-MS after Removal of Sodium and Potassium Ions (PMC)
- A Simple SDS-assisted Sample Preparation Method for LC-MS-based Proteomics (PMC)
- FDA M10 Bioanalytical Method Validation and Study Sample Analysis
- Immunogenicity of therapeutic peptide products (PMC)