
Peptide adsorption to plastic is the sticking of peptide molecules to the walls of tubes, pipette tips and vials, and it can remove most of a dilute sample before you ever measure it. In a 2015 study, three cationic peptides at 1 µM showed only 10–20% recovery after one hour in glass or polypropylene. The loss is predictable, though. It depends on the peptide, the surface, the concentration and the handling, so you can design it out of your workflow. Start with a verified, documented peptide, then control the container, the volume and the solvent.
This guide is for laboratory researchers who work with research-use peptides and need their numbers to mean something. Everything here concerns laboratory handling and analysis, not use in people or animals.
TL;DR
- Adsorption is noncovalent sticking of peptide to container surfaces. It can be severe at low concentrations and small amounts, and it hits plastic and glass alike.
- The same peptide can behave very differently across surfaces: in one 2011 study GLP-1 recovery was 20.5% in polypropylene and 3.7% in polystyrene.
- Losses grow with contact time, larger volumes and lower peptide input, so keep samples concentrated, short-lived and in suitable low-binding vessels.
- Acidifying to pH below 3, avoiding vacuum concentration and checking recovery with a simple dilution or transfer test are the most practical fixes.
- Start from a peptide with a lot-specific Certificate of Analysis, so a low reading points to handling and not to the material.
Table of Contents
- What peptide adsorption to plastic actually is
- How much sample can you lose?
- What makes adsorption worse
- How adsorption distorts your results
- How to tell adsorption from other losses
- Practical ways to reduce adsorption
- A short validation routine you can run this week
- Why the starting material matters
- Our perspective
- Research peptides and supplies from Data Peptides
- FAQ
- Sources
What peptide adsorption to plastic actually is
Adsorption means peptide molecules leave the liquid and attach to a solid surface. A 2023 peer-reviewed tutorial review describes it as noncovalent binding driven by hydrophobic and electrostatic interactions. No chemical bond forms, which is why the peptide is often still intact. It is simply no longer in the liquid you sample.
That distinction matters. Degradation changes the molecule. Adsorption removes it from solution. Your assay sees a lower concentration either way, but the fixes are different, so it helps to know which one you are fighting.
The same review notes that adsorption can occur in single-use containers, pipette tips, other consumables and LC systems, and in the worst cases it can cause complete peptide loss. A 2016 recommendations paper adds that the effect varies with primary sequence, surface material and concentration, and that it affects storage-vessel walls, tips, autosampler vials and HPLC components.
In practice, every surface your peptide touches between the lyophilized vial and the detector is a place where some of it can stay behind.
How much sample can you lose?
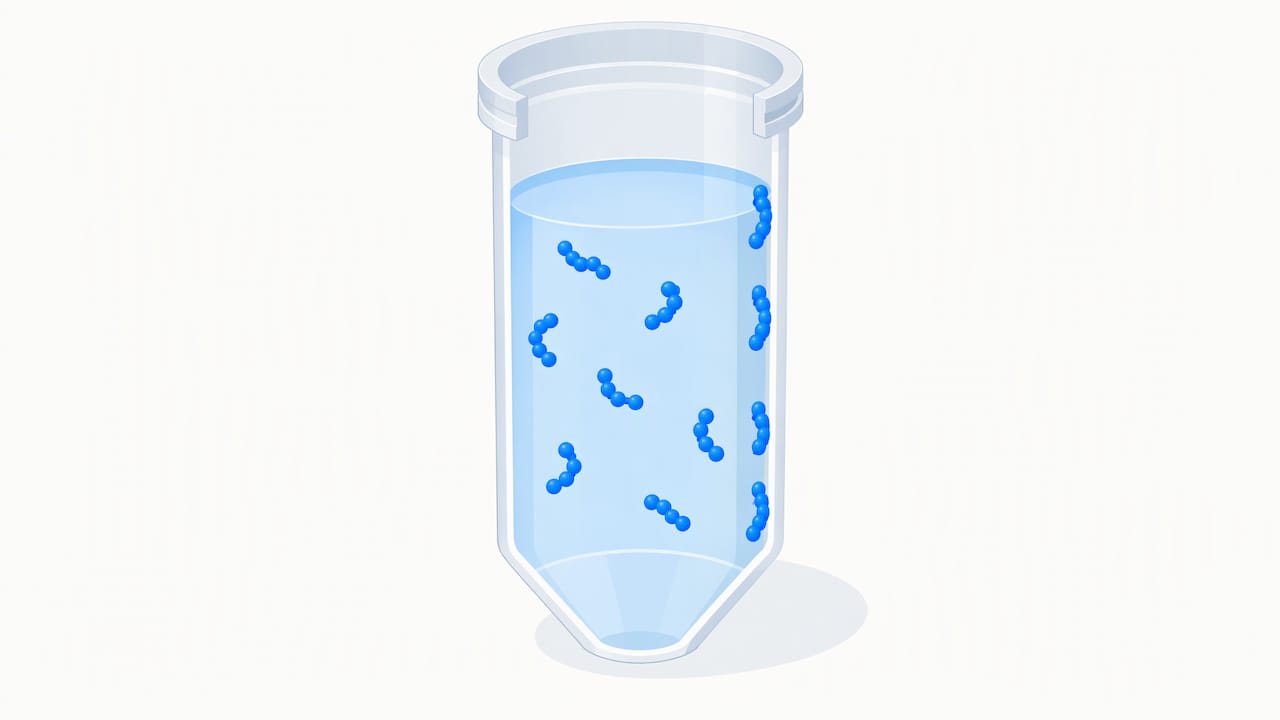
More than most people expect. In the 2015 PLOS ONE study, researchers measured mastoparan X, melittin and magainin 2, three cationic membrane-active peptides, after one hour in 220-µL solutions. At 1 µM, only 10–20% was recovered from borosilicate glass or polypropylene containers. The authors also found that the problem is not limited to tiny volumes with huge surface area: the data show that adsorption is not just a high surface-area-to-volume phenomenon.
The same work showed that higher peptide concentrations gave higher percentage recovery in both glass and polypropylene. That fits a simple picture: the wall has a limited number of binding sites, and once they are filled, the remaining peptide stays in solution.
A worked example makes this concrete. Suppose you prepare a 1 µM working solution and 80% of it sticks to the tube wall within an hour. Your assay reads 0.2 µM. Every downstream number, from potency to stability, is now off by a factor of five, and nothing in the raw data tells you why. Now suppose you prepare a 100 µM stock in the same tube. The wall still takes the same absolute amount, but the percentage lost is far smaller. That is why dilution series are where adsorption bites hardest.
What makes adsorption worse
The research points to a consistent set of drivers.
Peptide properties
Sequence matters. Cationic and hydrophobic peptides tend to stick readily, which is why the 2015 study used cationic membrane-active peptides as its models. Because the 2016 paper ties adsorption to primary sequence, you cannot assume that behavior seen with one peptide carries over to the next.
Surface material
There is no single “best” plastic. A 2011 peer-reviewed study compared plastics and glassware across several peptides. Polypropylene outperformed polystyrene for PYY, GLP-1, CRF and CCK-8S, while insulin recovery was similarly low in both plastics. Ghrelin recovered at about 90% in either. GLP-1 recovered at 20.5% in polypropylene and only 3.7% in polystyrene.
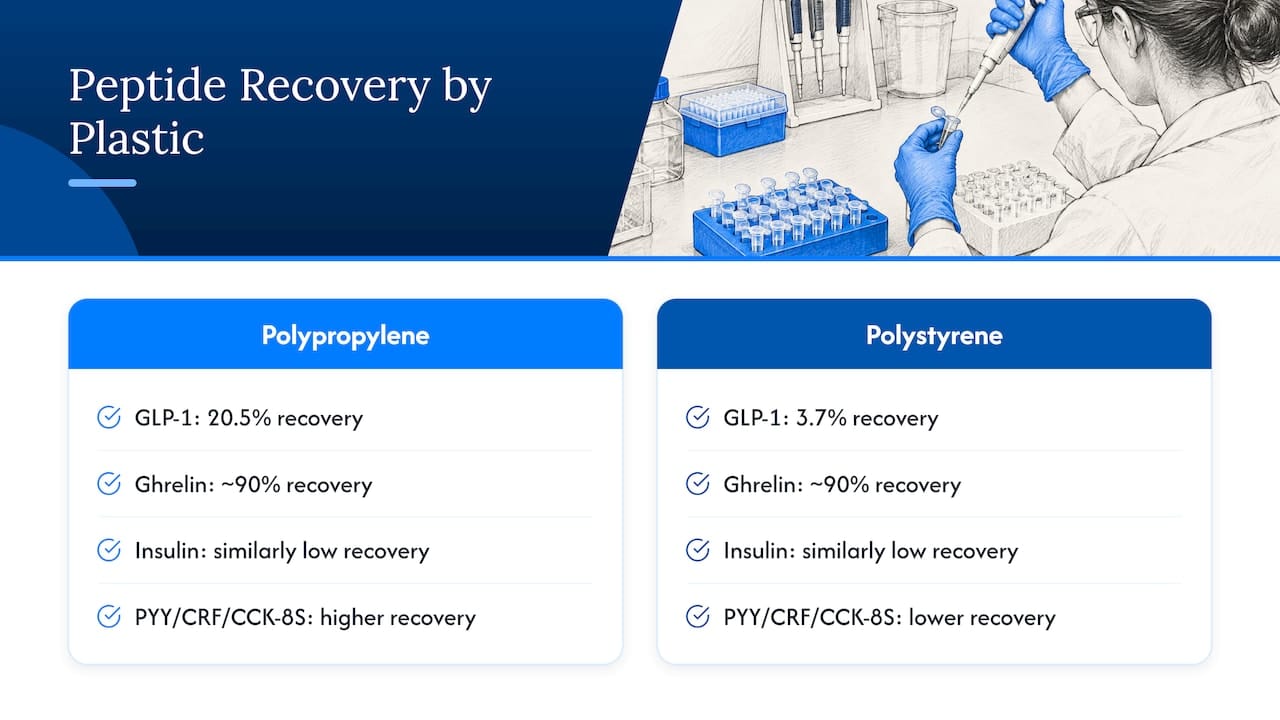
Read that carefully. Ghrelin barely cared which plastic you used. GLP-1 cared enormously, and even the better plastic lost most of it. The lesson is to test your own peptide, not to trust a rule of thumb.
Concentration, volume, time and conditions
The 2023 tutorial review reports that adsorption is affected by temperature, sample volume, pH and contact time, and that longer contact can raise binding until it plateaus. A 2026 chemical-proteomics study found losses were most apparent below 200 ng input and above 20 µL volume, and that they depended on acidification, buffer and plastic choice.
| Factor | Direction of risk | What to do |
|---|---|---|
| Peptide concentration | Lower concentration, higher percentage lost | Keep stocks concentrated; dilute just before use |
| Contact time | Longer contact, more binding until plateau | Shorten holds in plastic; plan the run order |
| Sample volume | Larger volumes at low input lose more in the 2026 study | Use the smallest practical volume |
| pH and buffer | Can raise or lower binding | Test your own conditions; acidify where the method allows |
| Surface type | Varies by peptide | Compare vessels with your own peptide |
How adsorption distorts your results
Adsorption is not just a yield problem. It changes the shape of your data.
The 2016 recommendations paper explains that adsorption can reduce sensitivity and distort concentration-response linearity, giving biased or variable quantitation, especially at low analyte levels. Residual peptide can also cause carryover, ion suppression of low-abundance analytes or false-positive signals in later runs.
A 2020 LC-MS study found the same thing from the calibration side. At low concentrations, adsorption can undermine linear response and produce more sigmoidal calibration curves, and low-bind tubes and vials improved response for its test analytes.
If you have ever seen a calibration curve that flattens or curls at the low end, or a lowest standard that will not behave, surface loss is a prime suspect. If you run mass spectrometry on peptides, our guide to LC-MS for peptides covers what else to check on the instrument side.
How to tell adsorption from other losses
Before changing your workflow, confirm that adsorption is the problem. The 2016 paper describes several approaches that need nothing exotic:
- Serial dilution by UV absorbance. Dilute a stock in steps and compare measured against expected values. A shortfall that grows at higher dilution points to surface loss.
- Repeated LC-MS injections. Re-inject the same vial over time. A signal that steadily drops while the vial sits suggests ongoing adsorption.
- Sequential vial-to-vial transfer. Move an aliquot from vial to vial and measure a portion after each transfer. If each transfer costs you signal, the surfaces are taking peptide.
- Blank injections. Run a blank after a sample. Signal in the blank indicates instrument carryover, which is a separate issue from container loss.
For surface-level comparisons, a 2024 peer-reviewed study used LC-MS/MS with a reference mixture of tryptic peptides to characterize adsorption across handling surfaces, identifying 3,531 peptides across samples. You do not need that scale for a single peptide, but the principle holds: measure the same material across candidate surfaces and let the data choose.
Keep degradation in view too. If recovery falls and new peaks appear, you may be seeing breakdown and not sticking. Our peptide stability testing guide covers that side.
Practical ways to reduce adsorption
Choose the vessel for your peptide
In the 2015 study, the three cationic peptides adsorbed to both borosilicate glass and polypropylene, but were not lost to the same extent in Protein LoBind tubes. The 2020 LC-MS study likewise found that low-bind tubes and vials improved response. Low-binding consumables are a sensible default for dilute peptide work, and the 2011 results show why you should still verify with your own peptide.
If you work with polypropylene autosampler vials, quality of the polypropylene matters, so check what your method actually needs.
Acidify, and avoid vacuum concentration
The 2026 study found that acidifying samples to pH below 3, freezing them if needed and loading directly onto Evotips improved its low-input workflow. Avoiding vacuum concentration produced up to roughly 90-fold gains at 10 ng. Drying a dilute peptide down in a plastic tube exposes it to a large wall area as the liquid disappears, which is a bad moment to be at low concentration.
These are results from a specific proteomics workflow. Check that your acid and pH fit your peptide and downstream assay before adopting them.
Add a carrier where the assay allows
The 2011 study found that adding 1% bovine serum albumin improved recovery for most of its tested peptides and did not increase losses. A carrier protein competes for wall sites, so more of your peptide stays free. The catch is compatibility: albumin can interfere with some downstream methods, so confirm that it suits your assay before you use it.
In the 2015 study, 1 mM POPC/POPG lipid vesicles prevented adsorption of mastoparan X to glass and polypropylene under the tested conditions. That is an informative mechanism study, and it shows that anything which occupies or shields the surface changes the outcome.
Keep concentration up and contact short
Because percentage loss falls as concentration rises, store working stocks as concentrated as your solubility allows, and make dilutions close to the time of use. Our peptide solubility guide explains how to dissolve peptides so a concentrated stock is practical in the first place.
Reduce handling steps
Every transfer is another surface. Pre-wetting tips can help in some workflows, and using fewer tubes between stock and plate means fewer places to lose material. Keep volumes small and matched to the vessel, since the 2026 study saw losses worsen above 20 µL at low input.
Store the solid correctly
Adsorption is mostly a solution problem. Lyophilized peptide is far less exposed, so the best time to hold material is before you reconstitute it. Follow our notes on keeping lyophilized peptides cold and dry, then reconstitute only what the run needs.
A short validation routine you can run this week
You can test your own setup in an afternoon.
- Prepare a stock at a concentration where adsorption is unlikely to matter, and verify it by your normal assay.
- Dilute to your lowest working concentration in each candidate vessel, for example standard polypropylene and a low-bind version.
- Hold the samples for the time your real workflow takes, then measure.
- Compare each result with the expected value. Add a second time point to see whether loss climbs or plateaus.
- Repeat with one change, such as acidification or a carrier, and keep whichever condition gives the best and most reproducible recovery.
- Write down the winning vessel, buffer, volume and hold time in your protocol so every run uses the same conditions.
This turns a vague worry into a documented parameter. Our peptide research protocols guide is a useful companion for building that kind of record.
Why the starting material matters
When a result looks low, you need to rule out the peptide itself before blaming the plastic. If purity or identity are uncertain, you cannot tell whether the shortfall comes from the tube or the material. That is why a lot-specific Certificate of Analysis and batch purity data are the baseline for any recovery experiment.
Our perspective
Researchers tend to blame the peptide when a number comes out wrong. Often the peptide is fine and the problem sits in the tube, the tip or the vial. Adsorption is a real, measurable effect, and the best defense is a clean starting point.
That is why we put documentation first. Our products are third-party batch tested for purity and identity, and every lot comes with a Certificate of Analysis and endotoxin data. When you know what went into the tube, a low recovery becomes a handling question you can answer, not a mystery.
We sell for laboratory research use only, and we ship fast and discreetly from our US facility. Our support team is available 24/7, so if you have a question about a lot or your documentation, you can reach us when your experiment needs it.
Data Peptides
Research peptides and supplies from Data Peptides
If you are setting up a recovery test or restocking, our peptide research supplies category covers the ancillaries side of the bench, and the full shop lists our research peptides across weight loss, muscle growth, recovery, anti-aging and libido categories. All products are sold for laboratory research use only.
FAQ
Does peptide adsorption happen in glass as well as plastic?
Yes. In the 2015 study, three cationic peptides adsorbed to both borosilicate glass and polypropylene, with recoveries of only 10–20% at 1 µM after one hour. Switching from plastic to glass is therefore not a reliable fix on its own.
Which plastic is best for peptides?
It depends on the peptide. A 2011 study found polypropylene beat polystyrene for several peptides, but insulin was poorly recovered in both and ghrelin was about 90% in either. Low-bind tubes improved results in the 2015 and 2020 studies, so they are a good first candidate to test.
Is adsorption worse at low concentrations?
Generally yes. The 2015 study found recovery rose with peptide concentration, consistent with surfaces becoming saturated. The 2026 study saw the clearest losses below 200 ng input, so dilute samples need the most care.
How can I check whether I am losing peptide to my tubes?
Run a serial dilution and compare measured against expected values, re-inject the same vial over time, or transfer an aliquot between vials and measure after each move. Add a blank injection to separate instrument carryover from container loss.
Sources
- Tutorial review for peptide assays (2023)
- Adsorption of Cationic Peptides to Solid Surfaces of Glass and Plastic (PLOS ONE, 2015)
- Recommendations for the generation, quantification, storage and handling of peptides (2016)
- The importance of using the optimal plastic and glassware in studies involving peptides (2011)
- Assay for Characterizing Adsorption Properties of Surfaces (2024)
- Optimized Sample Handling Minimizes Peptide Adsorption (2026)
- Improved intact peptide and protein quantitation by LC-MS (2020)